Drought Assessment Using Remote Sensing and Geographic Information
Systems (GIS) Techniques (Case Study: Klaten Regency, Indonesia)
Bashit, N.,1* Ristianti, N. S.2 and Ulfiana, D.3
1
Department of Geodetic Engineering, Faculty of Engineering, Diponegoro
University, Semarang, Indonesia
E-mail: nurhadi.bashit@live.undip.ac.id
2
Department of Urban and Regional Planning Engineering, Faculty of
Engineering, Diponegoro University, Semarang, Indonesia
3
Department of Civil Engineering, Faculty of Engineering, Diponegoro
University, Semarang, Indonesia
*Corresponding Author
DOI:
https://doi.org/10.52939/ijg.v18i5.2393
Abstract
Drought is a climate change phenomenon that is difficult to avoid,
so disaster mitigation planning is needed to minimize the impact of
damage. Drought potential mapping can take advantage of remote
sensing data and analysis of spatial data using a Geographic
Information System (GIS). Image extraction can produce Land Surface
Temperature (LST) data, vegetation index obtained from the
Normalized Difference Vegetation Index (NDVI) transformation, land
use obtained from Object-Based Image Analysis (OBIA), and wetness
index from the Normalized Difference Water Index (NDWI). This study
integrates data between image extraction results and regional
conditions such as rainfall, geological, soil types, and
hydrogeology. Klaten Regency has the potential for very high-class
drought covering an area of 101.53 ha. In Bayat district, the
results of the identification of potential drought indicate very
high levels of drought.
Keywords: Drought, Geographic Information System, Remote Sensing
1. Introduction
Indonesia is located on the equator, so there is a rainy and dry season
throughout the year. In the dry season, drought often occurs in several
areas due to the duration of the dry season being too long. Drought is
a natural disaster that is difficult to predict but can be detrimental
to human life. Indonesia often experiences meteorological drought in
several areas. Meteorological drought variables are based on rainfall
and temperature whose application can be determined on a local or
regional scale depending on the availability of data and the spatial
distribution of the earth station network (Rhee et al., 2010). The
availability of data makes it difficult to predict drought in large
areas. Drought is caused by an uneven distribution of rainfall over a
long period in an area (Lei and Duan, 2011 and Jamil et al., 2013).
Drought can also be interpreted as a lack of water supply compared to
the need for water for human purposes.
Drought affects various sectors in society such as agriculture,
ecosystem services, human health, recreation, and water resources and
is the most detrimental natural disaster. Therefore, drought has the
most damaging impact on various sectors compared to other natural
disasters because it causes water scarcity, agricultural drought, and
famine (Smith and Katz, 2013). Each region has different
characteristics so it is difficult to determine the approach to
identifying accurate drought characteristics (Hao et al., 2017).
Difficulties in identifying droughts encourage researchers to develop
related indicators of drought including the applications used, regional
conditions, and data availability in the area. In general, researchers
focus their research on drought in certain geographic areas that have
the potential for drought (Zhang et al., 2017a). Drought mapping has
temporal and spatial complexity, making it difficult to accurately
determine and identify the start and end of the drought and drought
duration (Wu et al., 2013). The potential for drought requires accurate
spatial data in describing information about an area so that it can
plan for handling drought disasters if at any time the disaster occurs.
The phenomenon of drought often occurs in Indonesia every year during
the dry season. One of the areas in Indonesia that often experiences
drought is Klaten Regency, Central Java Province. The drought in Klaten
Regency causes a lack of water supply for agricultural land so that
agriculture in the region is threatened with crop failure. The drought
in Klaten Regency occurs due to the long duration of dry season. Klaten
Regency is a type of meteorological drought due to the lack of
rainfall. The variability of rainfall is due to the various topographic
conditions of Klaten Regency so that the difference in the amount of
rainfall and its frequency. Rainfall in Klaten Regency has a different
intensity every year and has a monsoon trend (Putri and Nurjani, 2018).
The drought in Klaten Regency is also not only influenced by rainfall
but also by topographic conditions and soil types in the region.
Droughts are generally natural disasters that occur slowly although
sometimes they can occur quickly (Zhang et al., 2017b). At this time,
the drought disaster causes a high vulnerability impact on human life
systems and the environment (Van Loon et al., 2016). Identification of
potential drought can use field surveys, but it takes a long time and
costs a lot. This causes the conventional method to be abandoned even
though it obtains high accuracy results. Therefore, drought needs to be
identified using appropriate methods for accurate temporal continuous
mapping. Remote sensing data can provide data on the earth's surface
temporally and the application of Geographic Information Systems (GIS)
to analyze the potential for drought. Remote sensing has developed in
mapping the earth's surface so that it allows observations and
monitoring related to drought on a temporal and spatial scale better
than conventional methods (Sur et al., 2015). GIS can provide
convenience in performing spatial analysis such as analyzing the
potential for drought in an area. This study identified drought using a
combination of remote sensing methods and GIS. This method can carry
out continuous and consistent monitoring as well as provide the
availability of spatial data for drought analysis on a regional and
global scale, especially in areas without or rarely available spatial
data (Tang et al., 2009). Remote sensing has a role in monitoring
effective water management in areas that have limited spatial data
(Sheffield et al., 2018).
Remote sensing has made very rapid progress in providing continuous
spatial data with good spatial resolution, and the sensor can record
visible infrared, and near-infrared channels including thermal infrared
(Hadi et al., 2012). The development of remote sensing is found in the
detection of vegetation indices and land surface temperatures using
multitemporal remote sensing methods such as Landsat or the Moderate
Resolution Imaging Spectroradiometer (MODIS), these two satellites have
often been used for drought estimation with various earth surface
conditions (Asoka and Mishra, 2015). Therefore, this study analyzes the
potential for drought disasters in Klaten Regency by integrating remote
sensing and GIS. The data used in this study uses Landsat 8, Sentinel
2, and regional conditions such as rainfall, hydrogeology, soil type,
slope, and geology data. This study extracted images to obtain land
surface temperature (LST), the vegetation index was obtained from the
Normalized Difference Vegetation Index (NDVI) transformation, land use
was obtained from Object-Based Image Analysis (OBIA) and the
wettability index was obtained from the Normalized Transformation Water
Difference Index (NDWI). NDVI is an algorithm that can determine
environmental conditions based on vegetation density (Bannari et al.,
1995, Chen et al., 2012 and Rasmussen, 1998). The NDVI transformation
is often used for drought identification with various sensors at
global, continental, and regional scales (Nicolai-Shaw et al., 2017).
OBIA is an alternative to extracting land use using a pixel-based
method with the basic unit of analysis as the image object, not
individual pixels (Blaschke et al., 2008). OBIA is a remote sensing
data processing by combining Geographic Information (GI) (Hossain and
Chen, 2019). Meanwhile, the Normalized Difference Water Index (NDVI)
Transformation is one of the algorithms used to determine the
relationship between potential droughts in an area. The NDWI algorithm
is used to detect the humidity of an area because NDWI is very
sensitive to changes in leaf moisture content due to the SWIR spectrum
dominating the effect of water absorption on green vegetation
(Sánchez-Ruiz et al., 2014). Land Surface Temperature (LST) algorithm
is used to determine the distribution of surface temperature in the
research area to be used to analyze the potential for drought. This
study integrates remote sensing data and regional condition data to
obtain areas with the potential for drought using a geographic
information system (GIS).
2. Methodology
This study identifies potential drought disasters in Klaten Regency
which can be seen in Figure 1 using remote sensing data and shapefile
data (.shp) in the form of environmental physical condition data. The
flow of the process of carrying out this research is depicted in a flow
chart which can be seen in Figure 2.
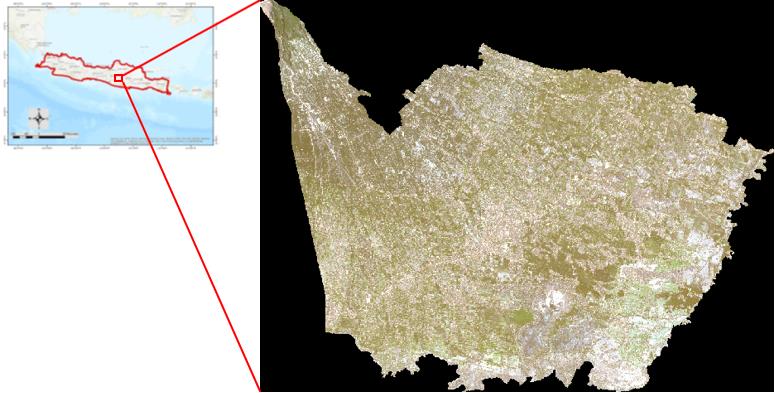
Figure 1 Study Area
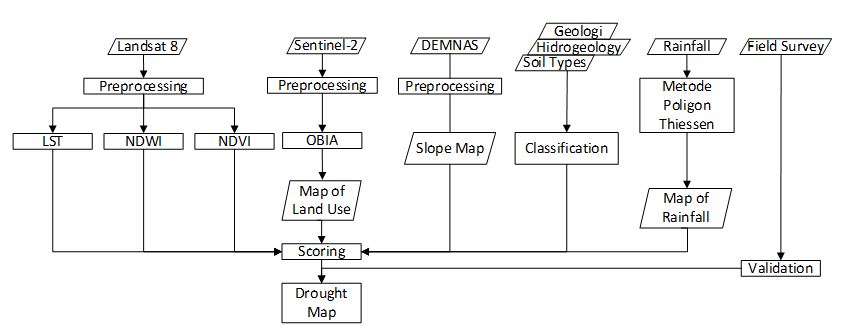
Figure 2 Study workflow
Table 1
Research Data
|
Date Type
|
Date
|
Source
|
|
Landsat 8 OLI
|
13 September 2019
|
earthexplorer.usgs.gov
|
|
Sentinel 2 L1C
|
26 September 2019
|
the Copernicus Open Access Hub
|
|
DEMNAS
|
22 September 2020
|
tanahair.indonesia.go.id
|
|
Rainfall
|
2010 to 2019
|
Semarang Climatology Station
|
|
Hydrogeology
|
2020
|
BAPPEDA Klaten Regency
|
|
Soil Type
|
2020
|
BAPPEDA Klaten Regency
|
|
Geology
|
2020
|
BAPPEDA Klaten Regency
|
Figure 2 shows the flow of research carried out to identify drought in
Klaten Regency. Meanwhile, the research data can be seen in Table 1 and
Figure 3. Landsat 8 data were processed to obtain LST, NDWI, and NDVI
values. Then, Citra Sentinel 2 produces a land use map from the results
of OBIA processing. Slope Map obtained from DEMNAS. Regional condition
data such as geological, hydrogeological, soil type, and map of
rainfall data are classified for drought analysis. All data were scored
to identify the drought disaster in Klaten Regency.
The field survey is used to validate the results of drought
identification and land use maps. Research data using Sentinel 2 L1C
recording on September 26, 2019 in the dry season. Data collection in
the dry season aims to determine the effect of the vegetation index on
the potential for drought. The dry season causes plants to become dry
and rice fields become unproductive. Vegetation growth is influenced by
monsoon rainfall so that the health status of vegetation is closely
related to rainfall (Ramadan et al., 2021).
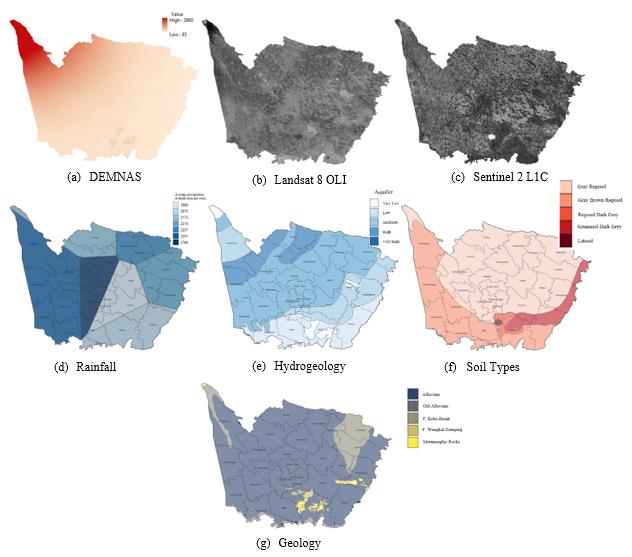
Figure 3
Research Data
2.1 Object-Based Image Analysis (OBIA)
The OBIA algorithm extracts satellite image data into an object based
on its spectral, spatial, and texture characteristics (Hay and
Castilla, 2008). OBIA produces satellite image classification by
grouping homogeneous pixels based on the identification of the
similarity of spectral values in the formation of an object
delineation by utilizing elements such as spectral, texture, and
spatial. OBIA has advantages compared to traditional pixel-based
classification methods (eg maximum likelihood classifier) because this
technique performs grouping of the same neighboring pixels into a
delineation object using specified parameters (Hulet et al., 2014).
OBIA also identifies objects based on the pattern recognition process
(Lei and Duan, 2011). OBIA utilizes a bottom-up approach by first
detecting the spectral values for each pixel that are homogeneous in
the formation of small objects, then combining them into large objects
according to their actual shape. The OBIA algorithm extracts satellite
image data based on image segmentation, the process divides the entire
image area into several non-overlapping polygonal object shapes
according to homogeneity or heterogeneity criteria, and each object has
the same internal feature shape including spectrum, spatial, texture,
shape, etc. (Dilpreet and Yadwinder, 2014).
2.2 Normalized Difference Vegetation Index (NDVI)
Multispectral satellite imagery data is extracted to obtain the
vegetation density of an area easily and quickly (Pirotti et al.,
2014). Vegetation density is extracted from satellite imagery based on
estimates of photosynthetic activity in a vegetated area by combining
the Red(R) and Near-Infrared (NIR) bands which can show the presence of
chlorophyll (Spadoni et al., 2020). The two bands are used as
vegetation index parameters because the results of the band size are
influenced by chlorophyll absorption, are sensitive to vegetation
biomass, and can distinguish between vegetated land, open land, and
water. The results of NDVI processing get a comparison of the ratio
values.
If the value is low then it can be classified as land without
vegetation such as waters, settlements, vacant land, and open land,
whereas if the value is high then it is classified as land with dense
vegetation (Andana, 2015). NDVI can show the vegetation density of an
area from high vegetation density to low vegetation density. The
spectral reflectance sensitivity of the Red (R) and Near-Infrared (NIR)
bands is influenced by the cellular structure of the leaves and the
chlorophyll pigment (Tucker, 1979). The NDVI algorithm equation can be
seen in Equation 1.
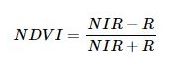
Eqaution 1
Equation 1 can be described where NIR is the reflectance value of the
near-infrared band, and R is the reflectance value of the red band. The
results of processing NDVI index obtained values with a range between
-1 and +1, in this case, the increasing value will affect the results
of vegetative density. NDVI can provide information on the thermal
trends of vegetation areas, land use types, and determination of
vegetation types (Yang et al., 2019 and Zeng et al., 2020).
2.3 Normalized Difference Water Index (NDWI)
NDWI is an algorithm used to estimate soil moisture and canopy moisture
content (Sánchez-Ruiz et al., 2014). NDWI is built based on the
assumption of spectral values in satellite images to obtain a wetness
index. The results of the NDWI can be classified that the lower the
value, the drier the area is, and conversely, the higher the value, the
wetter the area. NDWI is a popular index for determining drought based
on vegetation moisture. In this case, researchers have used NDWI in
identifying humidity and dryness in an area with satellite image data
(Gao, 1996). The application of NDWI utilizes a combination of band
channels between Near-Infrared (NIR) and Short Wave Infrared (Gao,
1996). In this case, NIR reflectance shows the internal structure of
dry leaves without moisture content, while SWIR reflectance shows the
effect of changes in vegetation moisture content and spongy mesophyll
structure on the vegetation canopy. The estimation of vegetation
moisture content using a combination of NIR and SWIR in increasing the
accuracy of the results because these two bands can eliminate
variations due to leaf internal structure and leaf dry matter content
(Ceccato et al., 2001). The NDWI algorithm can be seen in Equation 2.
Eqaution 2
Where RNIR is the reflection of the NIR band, while RSWIR is the reflectance of the SWIR band on Landsat 8. NDWI
in determining the wetness index is influenced by leaf moisture
content, vegetation type, and land cover (Gao, 1996). The results of
the NDWI value with high vegetation water content can be indicated by
the acquisition of a high value, while low vegetation water content and
low vegetation cover mean that it has a low NDWI value.
2.4 Land Surface Temperature (LST)
Remote sensing satellite images can be extracted to obtain ground
surface temperature data by utilizing the thermal infrared (TIR)
channel. LST from sensing data processing is much more applicable and
preferable to measuring ground stations in large-scale areas
(NourEldeen et al., 2020). Land surface temperature (LST) can be used
as the main parameter of environmental and urban dynamics studies to
determine the effect of surface energy balance and energy exchange that
can have an impact on the comfort of urban residents (Abdelmalik,
2020). LST can also be one of the parameters for determining drought
disasters. LST is obtained from the average ground surface temperature
for each pixel in the satellite image. Ground surface heat emission can
be captured by satellite image data by utilizing thermal infrared
wavelengths. The built area is influenced by the distribution of the
building and the surface temperature reaches 40◦C based on the results
of satellite imagery LST processing (Yang et al., 2021). Therefore,
Land Surface Temperature data can be used to determine meteorological
and hydroclimatic prediction models at regional and local scales (Dash
et al., 2002).
3. Results And Discussion
3.1 Object-Based Image Analysis (OBIA)
Classification of land use in this study using the OBIA method. In the
first stage, the scale parameter is determined in advance to determine
the large or small delineation of objects in the image. The value is
determined based on the smallest object that can be delineated in the
visually visible image. The delineation of the segmented object is
strongly influenced by the value of the scale parameter. If the given
value is large, the object delineation result will also be large. In
this case, the determination of the value must also consider the
smallest size of the object to be classified.
Inaccuracy in determining the value will result in the accuracy of land
use classification. In this case, the value of the scale parameter is
also greatly influenced by the resolution of the image used, so that
the application of this value between satellite images can be
different. The parameter value of this research scale uses a value of
60 with agricultural land class can be detected as the smallest object.
The results of the segmentation are classified into land use classes
that have been determined by selecting the training area in each class.
The number of samples is determined proportionally in each class. The
determination of the training area sample is influenced by the
operator's knowledge of visually identifying the image so that it can
affect the accuracy of the classification results. This study resulted
in a land use classification of 5 classes including built-up land, open
land, forest, agricultural land, and shrubs which can be seen in Table
2.
Land use using the OBIA method resulted in 5 classification classes.
Based on the classification results, the land use of Klaten Regency is
dominated by agricultural land with an area of 35,022 Ha or 50% of the
total area. This shows that the majority of the population of Klaten
Regency earns as farmers. Klaten Regency is also dominated by built-up
land classes with an area of 19,961 Ha or 28% of the total area. This
indicates that the central area of Klaten Regency is a developing
area with a high population density and is the center of government
activities. The land use of the region also shows that the further away
from the center of the region, the more dominated by the agricultural
class. The method used to test the accuracy of the results of land use
classification using a confusion matrix. Field survey data collection
is carried out proportionally according to the area of each class.
Field survey data in this study amounted to 200 points. Field survey
data is used to determine the level of suitability of land use
classification results based on actual objects in the field. The
results of the confusion matrix calculation obtain an overall accuracy
of 81%. The biggest misclassification in the Open Land class is caused
by the slight difference between the Open Land class and the Shrubs
class. These are difficult to distinguish because they have almost the
same range of values. The results of land use classification using the
OBIA method need to be tested for accuracy so that the accuracy of the
classification results can be used for various purposes. The accuracy
assessment uses field survey data as validation data for the
classification results to determine the level of truth. Test the
accuracy of the classification results using a confusion matrix
calculation to see the accuracy of the classification results from
satellite imagery. Accuracy assessment is carried out by utilizing 200
data from field surveys. The field survey data are spread across all
sub-districts in the Klaten regency. The results of land use
classification obtained an accuracy rate of 81%. The classification
results show some errors in the classification of objects in the form
of forests and shrubs that are mutually shrubs. This is because the
pixel value between forest and bush has almost the same value.
3.2 Normalized Difference Vegetation Index (NDVI)
This study produces a range of values between -0.01 to 0.899 using the
NDVI algorithm, the acquisition of this value range is because the
study area is mostly land so the range of values is relatively high.
The higher NDVI value indicates the greenness of the vegetation
(chlorophyll level) in plants, while the lower NDVI value indicates the
lower greenness of the vegetation (chlorophyll level). Therefore, the
NDVI value can be used as a parameter to see the vegetation density and
drought level of an area. The smaller the NDVI value, the more sparse
the vegetation density in the area and the greater the potential for
drought, while the greater the NDVI value, the higher the vegetation
density and the smaller the drought potential. The results of NDVI
values are classified into several classes as shown in Table 3. The
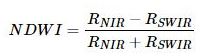
number of classes on the NDVI results is divided into 5 classes.
Determination of the class range based on the results of the field
survey and the visual appearance of the image. Non-vegetation class has
a range of values < 0. The very high vegetation density class has a
range of 0.675 to 0.899. The NDVI results represent the chlorophyll of
vegetation with the highest NDVI value in the land cover class in the
form of forest. Spectral reflectance is affected by dense vegetation
coverage.
Table 2
Land use classification
|
Land Use
|
Area (Ha)
|
Percentage (%)
|
|
Built-up Land
|
19,961
|
28
|
|
Open Land
|
7,038
|
10
|
|
Forest
|
2,474
|
4
|
|
Agricultural Land
|
35,022
|
50
|
|
Shrubs
|
5,528
|
8
|
Table 3 NDVI Results
|
No
|
Class
|
Description
|
Area (Ha)
|
|
1
|
< 0
|
No Vegetation
|
3.55
|
|
2
|
0 – 0.225
|
Low Vegetation Density
|
4,965.98
|
|
3
|
0.225 – 0.450
|
Medium Vegetation Density
|
28,053.89
|
|
4
|
0.450 – 0.675
|
High Vegetation Density
|
23,992.67
|
|
5
|
> 0.675
|
Very High Vegetation Density
|
12,952.25
|

Figure 4 Land Use maps in Klaten Regency
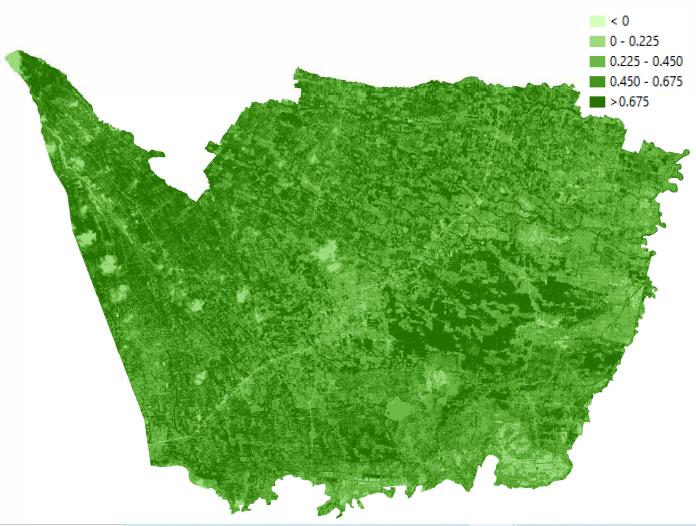
Figure 5
Normalized Difference Vegetation Index (NDVI) maps in Klaten Regency
Table 3 and Figure 5 show the results of NDVI processing in the Klaten
Regency. These results indicate that the vegetation density in the
study area is mostly in the medium to high vegetation density category.
The NDVI results can show that most of the Klaten Regency area is an
agricultural land area that is by the land use classification. The
category of low vegetation density is found in the city center. The
city center has a low vegetation density due to a lot of build-up land
in the area. Low vegetation density is also found in the southern area
because it is located at the foot of the low hills, namely the Jiwo
Hills. The plain is composed of Quaternary deposits. The rock unit
consists of alternating sandstone and siltstone and limestone lenses.
This causes the area to have low-density vegetation found in Bayat
district.
3.3 Normalized Difference Water Index (NDWI)
Normalized Difference Water Index transformation was used to determine
its relationship with the potential for drought. The NDWI value can be
assumed that the lower the NDWI value of an object, the drier the
object is, on the contrary, the higher the spectral value of the NDWI
result of an object, the wetter the object. This study produces NDWI
values with a range of values from -0.4 to 0.762. This research data
was recorded in September so that most areas in the Regency have NDWI
values with a low range of values. These results are caused by
September which is included in the dry season so the object in the
research area shows that most of the area is dry.
Based on Table 4, shows that the Klaten Regency area is mostly
dominated by very low wettability classes with an area of 30,298.17 ha,
most of which are in the Bayat district. Wetness index with very high
wetness category is mostly identified in swamp areas in Klaten Regency
because the area is waterlogged. A very low wetness index can indicate
that the area has the potential for drought.
3.4 Land Surface Temperature (LST)
The results of image processing obtain LST with a value range of 21° to
46° Celsius. LST in this study was divided into 5 classes including
21°-26°, 26°-31°, 31°-36°, 36°-41°, and 41° Celsius. The Klaten
Regency area mostly has LST with a range of 21°-26° located on the
slopes of Mount Merapi which has relatively cool air compared to other
areas. The area which has relatively high ground surface temperature is
in Bayat district. Bayat sub-district has a high ground surface
temperature which causes the area to be prone to drought.
Based on Table 5, shows that the distribution of LST in the Klaten
Regency is dominated by the 26°-31° Celsius class. This shows the
normal class temperature that occurs in the area because the land use
in the area is in the form of agricultural land and built-up land.
Several areas in Klaten Regency have LST values of 41°-46° Celsius
and 46° Celsius. Land Surface Temperature class with a high
category in an area can trigger the potential for drought if it occurs
for a long period.
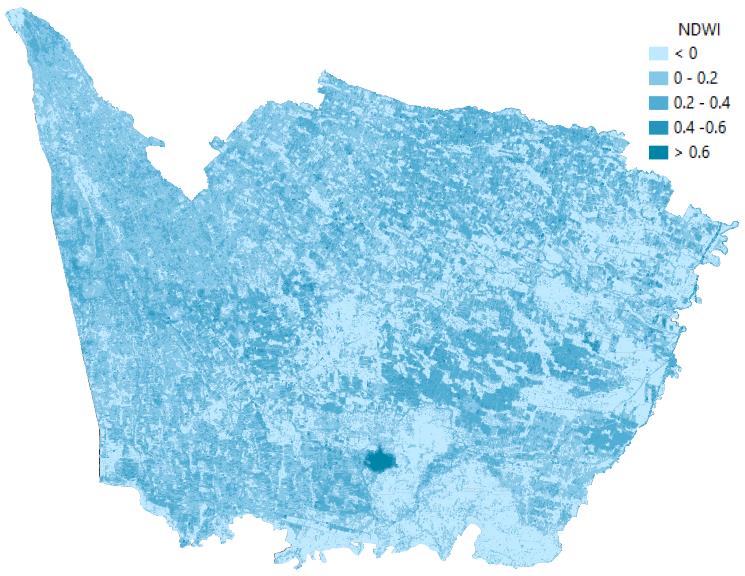
Figure 6 NDWI Results maps in Klaten Regency
Table 4 NDWI results
|
No
|
Class
|
Description
|
Area (Ha)
|
|
1
|
< 0
|
Very low wetness
|
30,298.17
|
|
2
|
0 – 0.2
|
Low wetness
|
28,627.63
|
|
3
|
0.2 – 0.4
|
Moderate wetness
|
10,744.96
|
|
4
|
0.4 – 0.6
|
High wetness
|
205.57
|
|
5
|
> 0.6
|
Very high wetness
|
92.67
|
Table 5
Classification of Land Surface Temperature Klaten Regency
|
No
|
Class LST (Celcius)
|
Area (Ha)
|
|
1
|
21°-26°
|
1,800.09
|
|
2
|
26°-31°
|
35,375.40
|
|
3
|
31°-36°
|
31,279.05
|
|
4
|
41°-46°
|
1,498.05
|
|
5
|
>46°
|
9.45
|
Figure 7 Land Surface Temperature Klaten Regency
3.5 Drought Potential
The results of processing satellite image data produce land use data,
NDWI, NDVI, LST, and regional conditions such as rainfall,
hydrogeology, soil type, slope, and geology in order to obtain the
potential for drought disasters in Klaten Regency. LST and NDVI provide
importance in detecting potential drought disasters for large and
medium scale areas (Wijayanti et al., 2021). Rainfall data were
obtained from seven rain stations including Cokrotulung, Bawak,
Karangnongko, Tegal Duwur, Karangdowo, Ngupit, and Ketandan. Data
processing uses the Thiessen polygon method to determine the magnitude
of the influence of rain stations on rainfall in each sub-district for
10 years from 2010 to 2019. The results of rainfall processing are
obtained in the annual rainfall range of 1.966-2.746 mm which is
classified into class 3. Data Land use in Figure 4 is classified and
assessed based on objects that have the potential to cause drought in
the order of built-up land, open land, shrubs, agricultural land, and
forest. Forests and agricultural land are in the last order and the
score is small because they do not have an impact on drought. The
vegetation index as a result of NDVI processing is given a score based
on the value of -0.01-0.2 to 0.5-0.899 from the No Vegetation class
which is given the highest score because it has an impact on drought
and the lowest score is in the Very High Vegetation Density class in
Figure 5. Parameters Wetness index from NDWI processing was used to
determine the level of potential drought with a value range of -0.4-0
to 0.4 - 0.762. The higher the NDWI value, the lower the vulnerability
to drought and vice versa. The NDWI value is divided into 5 classes
with the same value and the scoring value is given based on Figure 6.
The land surface temperature (LST) parameter in Figure 7 is given a
score of 1 to 5 based on the temperature value range between 21° to
> 46°C. The potential for drought can also be determined from the
hydrogeological parameters in Klaten Regency. Groundwater conditions
can describe the amount of water below the ground so that
hydrogeological data are classified and scored based on the condition
of the amount of water that has high productivity to rare groundwater.
Topographic conditions are also a factor causing drought, so the
steeper the slope, the higher the risk of drought.
Table 6
Classification of potential drought in Klaten Regency
|
No
|
Class
|
Area (ha)
|
|
1
|
Very Low
|
2,425.39
|
|
2
|
Low
|
45,606.31
|
|
3
|
Moderate
|
19,678.26
|
|
4
|
High
|
1,988.84
|
|
5
|
Very High
|
101.53
|
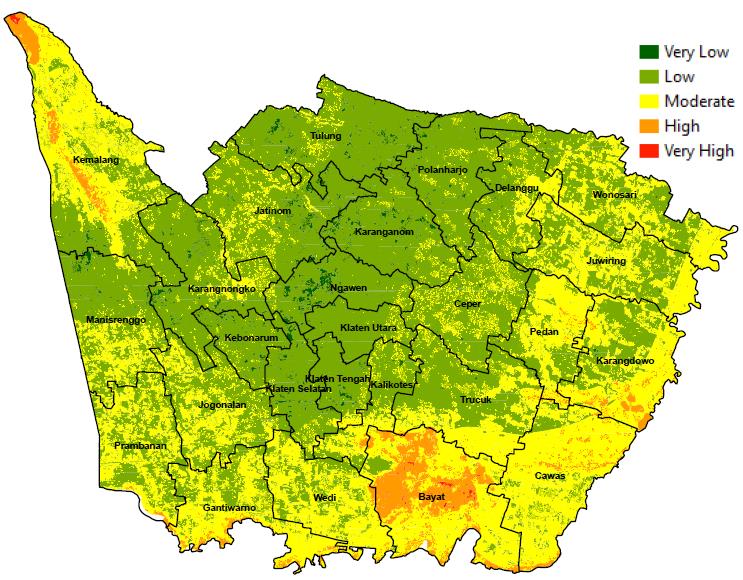
Figure 8 Map of potential drought in Klaten Regency
Therefore, the slope data are classified in the range of 0-8%, 5-15%,
15-25%, 25-45%, and 45%. Klaten Regency has a diversity of
geological structures that can provide different potential impacts on
each type of drought. Geological structures are classified based on
their types that can affect the potential for drought in Klaten
Regency. Geological structure affects surface water flow. Soil type
greatly affects drought because it affects the ability of the soil to
hold water below the surface. The ability of the soil is represented by
the condition of soil moisture in storing water so that it can indicate
the level of drought based on the availability of groundwater. Klaten
Regency consists of soil types in the form of gray regosol, gray brown
regosol, regosol dark grey, grumusol dark grey, and litosol which are
classified based on the ability of the soil to hold water below the
surface. All parameters are done by adding up the scores for each
predetermined class. The scoring values for all parameters are added up
to obtain a range of values between 15 to 38. The results of the range
of potential drought values are classified based on the level of
drought which can be seen in Table 6 by dividing into 5 classes with
the same range value for each class.
The scores for each parameter were summed so that the scores ranged
from 15 to 38. The scores were divided into 5 classes with the same
distribution. Figure 8 shows the identification of drought in Klaten
Regency. The majority of the Klaten Regency area does not have the
potential for drought, but there are some areas that have been
identified as drought. Based on the results of the processing, several
sub-districts have the potential for drought including the districts of
Kemalang, Manisrenggo, Jatinom, Prambanan, Trucuk, Bayat, Pedan, and
Karangdowo. The results of the classification show that Bayat district
has very high, high, and moderate drought classes, indicating that the
area has a high potential for drought in the dry season. The Bayat
district area has the potential to experience drought due to the type
of soil in the form of littoral soil. This type of soil is a type of
soil that is difficult for plants to grow because of its low nutrient
content. Hydrogeological data shows Bayat district is an area where
groundwater is scarce. This causes Bayat district to have a high
potential for drought. Bayat district has an annual rainfall volume
with a relatively moderate category of 2,073 mm/year obtained from
Bawak station.
Even so, if there is a dry season, Bayat district has the potential to
experience drought. In addition, land surface temperature also plays a role
in determining the potential for drought where Bayat district has a higher
surface temperature than other districts. The results of the transformation
of the NDVI and NDWI algorithms show that Bayat district has a low
vegetation density and level of wetness.
4. Conclusions
The results of the identification of potential droughts in Klaten Regency
are areas that may experience droughts such as Kemalang, Manisrenggo,
Jatinom, Prambanan, Trucuk, Bayat, Pedan, and Karangdowo sub-districts. The
results of the classification show that Klaten Regency has a very high
level of drought covering an area of 1,988.84 ha and a very high area of
101.53 ha and a moderate area of 19,678.26 ha. Klaten Regency shows
that the southern region may experience the highest drought, which is
located in Bayat Sub-district. Based on the processing of satellite image
data using NDVI, NDWI, LST, it is known that the sub-district has a low
vegetation density, a low wettability index, and a land surface temperature
in the range of 41°- 46° Celsius and 46° Celsius. Bayat district is
located at the foot of the Jiwo Hills with a steep slope, the rocks consist
of sandstone and limestone lenses. Some of these things have caused Bayat
district to become one of the sub-districts with a very high potential for
drought.
References
Abdelmalik, K. W., 2020,
Landsat 8: Utilizing Sensitive Response Bands Concept for Image Processing and Mapping Of Basalts.
Egypt. J. Remote Sens. Sp. Sci., Vol. 23, 263–274.
https://doi.org/10.1016/j.ejrs.2019.04.004.
Andana, E. K., 2015,
Pengembangan Data Citra Satelit Landsat-8 Untuk Pemetaan Area Tanaman Hortikultura Dengan Berbagai Metode Algoritma Indeks
Vegetasi (Studi Kasus: Kabupaten Malang Dan Sekitarnya).
Nas. Manaj. Teknol., Vol. 9, 1–10.
Asoka, A. and Mishra, V., 2015,
Prediction of Vegetation Anomalies to Improve Food Security and Water Management in India.
Geophys. Res. Lett., Vol. 42, 5290–5298.
https://doi.org/10.1002/2015GL063991.
Bannari, A., Morin, D., Bonn, F. and Huete, A. R., 1995,
A Review of Vegetation Indices. Remote Sens. Rev., Vol. 13, 95–120.
Blaschke, T., Lang, S. and Hay, G. J., 2008,
Object-Based Image Analysis : Spatial Concepts for Knowledge-Driven
Remote Sensing Applications, Technology. Springer Science & Business Media.
Ceccato, P., Flasse, S., Tarantola, S., Jacquemoud, S. and Grégoire, J. M., 2001,
Detecting Vegetation Leaf Water Content Using Reflectance in the Optical Domain.
Remote Sens. Environ., Vol. 77, 22–33.
Chen, J., Wang, B. and Sun, J., 2012,
Scale Correction of Two-Band Ratio of Red to Near-Infrared Using Imagery Histogram Approach:
A Case Study on Indian Remote Sensing Satellite in Yellow River Estuary.
IEEE J. Sel. Top. Appl. Earth Obs. Remote Sens., Vol. 5, 663–668.
https://doi.org/10.1109/JSTARS.2011.2182182.
Dash, P., Göttsche, F. M., Olesen, F. S. and Fischer, H., 2002,
Land Surface Temperature and Emissivity Estimation from Passive Sensor Data:
Theory and Practice-Current Trends. Int. J. Remote Sens., Vol. 23, 2563–2594.
https://doi.org/10.1080/01431160110115041.
Dilpreet, K. and Yadwinder, K., 2014,
Various Image Segmentation Techniques: A Review.
Int. J. Comput. Sci. Mob. Comput., Vol. 3, 809–814.
Gao, B. C., 1996,
NDWI A Normalized Difference Water Index for Remote Sensing of Vegetation Liquid Water From Space.
Remote Sens. Environ., Vol. 58, 257–266.
https://doi.org/10.1016/S0034-4257(96)00067-3.
Hadi, A. P., Danoedoro, P. and Sudaryatno, 2012,
Determination of Land Dryness Level Based on Analysis of Daisies and Geographic Information Systems.
Maj. Geogr. Indones., Vol. 26, 1–26.
Hao, Z., Yuan, X., Xia, Y., Hao, F. and Singh, V. P., 2017,
An Overview of Drought Monitoring and Prediction Systems at regional and Global Scales.
Bull. Am. Meteorol. Soc., Vol. 98, 1879–1896.
https://www.jstor.org/stable/26394320.
Hay, G. J. and Castilla, G., 2008,
Geographic Object-Based Image Analysis (GEOBIA): A New Name for a New Discipline. Lect.
Notes Geoinf. Cartogr., 75–89,
https://doi.org/10.1007/978-3-540-77058-9_4.
Hossain, M. D. and Chen, D., 2019,
Segmentation for Object-Based Image Analysis (OBIA):
A Review of Algorithms and Challenges from Remote Sensing Perspective.
ISPRS J. Photogramm. Remote Sens., Vol. 150, 115–134.
https://doi.org/10.1016/j.isprsjprs.2019.02.009.
Hulet, A., Roundy, B. A., Petersen, S. L., Jensen, R. R. and Bunting, S.C., 2014,
Cover Estimations Using Object-Based Image Analysis Rule Sets Developed Across Multiple Scales in Pinyon-Juniper Woodlands. Rangel. Ecol. Manag., Vol. 67, 318–327.
https://doi.org/10.2111/REM-D-12-00154.1.
Jamil Habibi, D., Tjahjono, H. and Parman, S., 2013,
Deteksi Potensi Kekeringan Berbasis Penginderaan Jauh Dan Sistem Informasi Geografis Di Kabupaten Klaten.
J. Geo Image, Vol. 2, 30–37.
Lei, Y. and Duan, A., 2011,
Prolonged Dry Episodes and Drought Over China.
Int. J. Climatol., Vol. 31, 1831–1840.
https://doi.org/10.1002/joc.2197.
Nicolai-Shaw, N., Zscheischler, J., Hirschi, M., Gudmundsson, L., and Seneviratne, S. I., 2017,
A Drought Event Composite Analysis Using Satellite Remote-Sensing Based Soil Moisture.
Remote Sens. Environ., Vol. 203, 216–225.
https://doi.org/10.1016/j.rse.2017.06.014.
NourEldeen, N., Mao, K., Yuan, Z., Shen, X., Xu, T. and Qin, Z., 2020,
Analysis of the Spatiotemporal Change in Land Surface Temperature for a
Long-Term Sequence in Africa (2003-2017). Remote Sens., Vol. 12,1–25.
https://doi.org/10.3390/rs12030488.
Pirotti, F., Parraga, M.A., Stuaro, E., Dubbini, M., Masiero, A. and Ramanzin, M., 2014,
NDVI from Landsat 8 Vegetation Indices to Study Movement Dynamics of Capra ibex in Mountain Areas.
Int. Arch. Photogramm. Remote Sens. Spat. Inf. Sci. - ISPRS Arch., Vol. 40, 147–153.
https://doi.org/10.5194/isprsarchives-XL-7-147-2014.
Putri, I. I. and Nurjani, E., 2018,
Persepsi dan Adaptasi Petani Padi Lahan Kering di Klaten Terhadap Variabilitas Curah Hujan.
J. Bumi Indones. 1–12.
Ramadan, E., Al-Awadhi, T. and Charabi, Y., 2021,
Land Cover/Land Use change and Climate Change in Dhofar Governorate, Oman.
Int. J. Geoinformatics, Vol. 17, 41–47.
https://doi.org/10.52939/ijg.v17i4.1949.
Rasmussen, M. S., 1998,
Developing Simple, Operational, Consistent NDVI-vegetation Models by Applying Environmental and Climatic Information:
Part I. Assessment of Net Primary Production. Int. J. Remote Sens., Vol. 19, 97–117.
https://doi.org/10.1080/014311698216459.
Rhee, J., Im, J. and Carbone, G. J., 2010,
Monitoring Agricultural Drought for Arid and Humid Regions Using Multi-Sensor Remote Sensing Data.
Remote Sens. Environ., Vol. 114, 2875–2887.
https://doi.org/10.1016/j.rse.2010.07.005.
Sánchez-Ruiz, S., Piles, M., Sánchez, N., Martínez-Fernández, J., Vall-llossera, M. and Camps, A., 2014, Combining SMOS with Visible and Near/Shortwave/Thermal Infrared Satellite Data for High Resolution Soil Moisture Estimates. J. Hydrol., Vol. 516, 273–283.
https://doi.org/10.1016/j.jhydrol.2013.12.047.
Sheffield, J., Wood, E. F., Pan, M., Beck, H., Coccia, G.,
Serrat-Capdevila, A. and Verbist, K., 2018,
Satellite Remote Sensing for Water Resources Management: Potential for Supporting Sustainable
Development in Data-Poor Regions. Water Resour. Res., Vol. 54, 9724–9758.
https://doi.org/10.1029/2017WR022437.
Smith, A. B. and Katz, R. W., 2013,
US Billion-Dollar Weather and Climate Disasters: Data Sources, Trends, Accuracy and Biases.
Nat. Hazards, Vol. 67, 387–410.
https://doi.org/10.1007/s11069-013-0566-5.
Spadoni, G. L., Cavalli, A., Congedo, L. and Munafò, M., 2020,
Analysis of Normalized Difference Vegetation Index (NDVI) Multi-Temporal Series for the
Production of Forest Cartography. Remote Sens. Appl. Soc. Environ., Vol. 20,
https://doi.org/10.1016/j.rsase.2020.100419.
Sur, C., Hur, J., Kim, K., Choi, W. and Choi, M., 2015.
An Evaluation of Satellite-Based Drought Indices on a regional Scale.
Int. J. Remote Sens., Vol. 36, 5593–5612.
https://doi.org/10.1080/01431161.2015.1101653.
Tang, Q., Gao, H., Lu, H. and Lettenmaier, D. P., 2009,
Remote Sensing:Hydrology. Prog. Phys. Geogr., Vol. 33, 490–509.
https://doi.org/10.1177/0309133309346650.
Tucker, C. J., 1979,
Red and Photographic Infrared Linear Combinations for Monitoring Vegetation.
Remote Sens. Environ., Vol. 8, 127–150.
https://doi.org/10.1016/0034-4257(79)90013-0.
Van Loon, A. F., Gleeson, T., Clark, J., Van Dijk, A. I. J. M., Stahl, K.,
Hannaford, J., Di Baldassarre, G., Teuling, A. J., Tallaksen, L. M.,
Uijlenhoet, R., Hannah, D. M., Sheffield, J., Svoboda, M., Verbeiren, B.,
Wagener, T., Rangecroft, S., Wanders, N. and Van Lanen, H. A. J., 2016,
Drought in the Anthropocene. Nat. Geosci., Vol. 9, 89–91.
Wijayanti, R. F., Jaelani, L. M., Handayani, H. H. and Chu, H. J., 2021,
Drought Index Mapping in Java Island Using Sentinel-3 slstr.
Int. J. Geoinformatics, Vol. 17, 97–108.
https://doi.org/10.52939/IJG.V17I4.1959.
Wu, J., Zhou, L., Liu, M., Zhang, J., Leng, S. and Diao, C., 2013,
Establishing and Assessing the Integrated Surface Drought Index (ISDI) for
Agricultural Drought Monitoring in Mid-Eastern China. Int. J. Appl. Earth Obs. Geoinf., Vol. 23, 397–410.
https://doi.org/10.1016/j.jag.2012.11.003.
Yang, J., Ren, J., Sun, D., Xiao, X., Xia, J. (Cecilia), Jin, C. and Li, X., 2021,
Understanding Land Surface Temperature Impact Factors Based on Local Climate Zones. Sustain. Cities Soc., Vol. 69.
https://doi.org/10.1016/j.scs.2021.102818.
Yang, Y., Wu, T., Wang, S., Li, J. and Muhanmmad, F., 2019,
The NDVI-CV Method for Mapping Evergreen Trees in Complex Urban Areas using Reconstructed LANDSAT 8 Time-Series Data. Forests, Vol. 10.
https://doi.org/10.3390/f10020139.
Zeng, L., Wardlow, B. D., Xiang, D., Hu, S. and Li, D., 2020,
A Review of Vegetation Phenological Metrics Extraction Using Time-Series, Multispectral Satellite Data.
Remote Sens. Environ., Vol. 237.
https://doi.org/10.1016/j.rse.2019.111511.
Zhang, L., Jiao, W., Zhang, H., Huang, C. and Tong, Q., 2017,
Studying Drought Phenomena in the Continental United States in 2011 and 2012 Using Various Drought Indices.
Remote Sens. Environ., Vol. 190, 96–106.
Zhang, X., Chen, N., Li, J., Chen, Z. and Niyogi, D., 2017,
Multi-sensor Integrated Framework and Index for Agricultural Drought Monitoring.
Remote Sens. Environ., Vol. 188, 141–163.
https://doi.org/10.1016/j.rse.2016.10.045.