![]()
Frontline Learning Research Vol.8 No. 2 (2020) 35
- 64
ISSN 2295-3159
aDepartment of Education,
Utrecht University, The Netherlands
Article received 9 July 2019/ revised 3 February 2020/ accepted 4 March / available online 9 april
To be successful in online education, learners should be able to self-regulate their learning due to the autonomy offered to them. Accurate measurement of learners’ self-regulated learning (SRL) in online education is necessary to determine which learners are in need of support and how to best offer support. Trace data is gathered automatically and unobtrusively during online education, and is therefore considered a valuable source to measure learners’ SRL. However, measuring SRL with trace data is challenging for two main reasons. First, without information on the how and why of learner behaviour it is difficult to interpret trace data correctly. Second, SRL activities outside of the online learning environment are not captured in trace data. To address these two challenges, we propose a mixed method approach with a sequential design. Such an approach is novel for the measurement of SRL. We present a pilot study in which we combined trace data with interview data to analyse learners’ SRL in online courses. In the interview, cued retrospective reporting was conducted by presenting learners with visualizations of their trace data. In the second part of the interview, learners’ activities outside of the online course environment were discussed. The results show that the mixed-method approach is indeed a promising approach to address the two described challenges. Suggestions for future research are provided, and include methodological considerations such as how to best visualize trace data for cued retrospective recall.
Keywords: interview; mixed-method research; online education; self-regulated learning; trace data
Online learning has increased rapidly over the past years (Allen & Seaman, 2014, 2016). Not only are online learning materials increasingly included in campus-based education, the amount of courses offered fully online has also expanded rapidly. Such courses that are offered fully online are called Massive Open Online Courses (MOOCs) which have become increasingly common in higher education. They are accessible to anyone with an Internet connection without requirements regarding prior knowledge. In some cases, costs are involved to participate in graded assignments, but access to the learning materials (e.g., videos, readings) is always free. In these online courses, learners are free to decide when, where, and what they study. This increased autonomy in online education requires learners to self-regulate their learning to a greater extent compared to students in traditional campus-based education (Azevedo & Aleven, 2013; Beishuizen & Steffens, 2011; Broadbent, 2017; Hew & Cheung, 2014; Wang, Shannon, & Ross, 2013). The measurement, analysis, and support of self-regulated learning (SRL) in the context of online education is therefore of high scientific as well as practical relevance.
In order to examine students’ SRL in online education, researchers have increasingly focused their attention on trace data (Van Laer & Elen, 2018; Winne, 2010). In online education, all learners’ interactions with the online course materials (e.g., videos, assignments, forum discussions) are stored. These so-called traces of learner behaviour are stored as time stamped events, providing an overview of all learners activities within the online learning environment. Using trace data as an indicator for learners’ SRL is considered a promising approach because the data are gathered automatically, unobtrusively, and over longer durations of time (Rovers, Clarebout, Savelberg, De Bruin, & Van Merriënboer, 2019; Van Laer & Elen, 2018). Over the past years, the call for fine-grained process measures of SRL has strengthened (e.g., Winne, 2010) and researchers have therefore started using trace data to measure SRL (e.g., Cicchinelli et al., 2018; Van Laer & Elen, 2018). Using data mining techniques, trace data could be used to automatically measure and support SRL, for example by automatically detecting when students show a lack of self-regulation and subsequently offering feedback, suggestions, or other forms of interventions. However, in order to accurately measure students’ SRL from trace data, it should be possible to interpret trace data in terms of SRL in a reliable and valid way.
Interpreting learners’ SRL based on trace data is challenging for multiple reasons. First, while trace data show what and when learners study, it does not provide information on how and why learners engaged with the learning material the way they did (Jovanović, Gašević, Dawson, Pardo, & Mirriahi, 2017; Min & Jingyan, 2017; Phillips et al., 2011). Second, trace data are limited to capturing learners’ behaviour in the online learning environment only, and thus does not include other learning behaviour, such as browsing websites or making notes on paper. These two reasons combined mean that translating trace data into conclusions about learners’ SRL is challenging because of the possibility of misinterpreting certain events or overlooking relevant events. It has therefore been argued that a mixed method approach, in which trace data are combined with other methods to measure SRL, is useful and necessary to draw valid conclusions from the trace data (Cicchinelli et al., 2018; Howard-Rose & Winne, 1993; Jovanović et al., 2017; Karabenick & Zusho, 2015; Reimann, Markauskaite, & Bannert, 2014).
In this methodological paper, our aim is to demonstrate that interview data could be a valuable addition to trace data to measure and analyse learners’ SRL in online education. Through interviews, researchers are able to examine learners’ reasons behind their activities, as well as to gather an overview of their activities outside of the online learning environment, thus offering the possibility to overcome the challenges outlined above. In this paper, we present a pilot study in which we combined trace data with interview data, and discuss the methodological possibilities and challenges of our approach concerning the aim to understand learners’ SRL in online education.
Self-regulated learners are defined as motivationally, metacognitively, and behaviourally active in their own learning process (Zimmerman, 1986). Self-regulated learners engage in a number of activities, including goal setting, planning, monitoring, reflection, attention focusing, time management, environment structuring, and seeking help when needed (Panadero, 2017; Puustinen & Pulkkinen, 2001). Thus, the extent to which learners adapt to changes in the task and learning context is a critical component of SRL (Azevedo & Cromley, 2004; Hadwin, Nesbit, Jamieson-Noel, Code, & Winne, 2007). As SRL is considered a process, any measurement of SRL must take into account changes in learners’ behaviour over time (Azevedo et al., 2013; Winne, 2010). As outlined above, trace data allow for the capturing of learners’ activities unobtrusively over time at a very fine granularity. Trace data provide a reliable measure of when students engaged in the online learning environment and with what materials they engaged, and offers information about temporal and sequential characteristics of activities, making it a readily available and valuable data source to study learners’ SRL (Cicchinelli et al., 2018; Fincham, Gasevic, Jovanovic, & Pardo, 2018; Hadwin et al., 2007; Kizilcec, Pérez-Sanagustín, & Maldonado, 2017; Maldonado-Mahauad, Pérez-Sanagustín, Kizilcec, Morales, & Munoz-Gama, 2018; Winne, 2014). Several authors have used trace data to attempt to locate learner behaviour that is representative of SRL activities (Van Laer & Elen, 2018). For example, in the study of Kizilcec et al. (2017), SRL questionnaire data were coupled to learner behaviour information stored in trace data to identify learner activities related to SRL. Similarly, Min and Jingyan (2017) also used trace data as a measure of SRL. Before their data collection, Min and Jingyan defined sequences of learner behaviour that, in their view, were indicative of SRL. Learners whose trace data included sequences indicative of all defined SRL activities had greater persistence in the course and achieved higher course grades. These exemplary studies show trace data may be beneficial for studying SRL in online education: trace data are gathered unobtrusively, can be analysed automatically for large groups of learners, and may in the future even be used for real time support of learners (Van Laer & Elen, 2018).
However, the same studies also demonstrate the challenges of using trace data as a measurement of SRL. The most striking problem is that while trace data shed light on leaners’ behaviour in the online learning environment, there is doubt on how to interpret behaviour in terms of SRL (Cicchinelli et al., 2018; Jovanović et al., 2017; Min & Jingyan, 2017; Phillips et al., 2011; Rovers et al., 2019). SRL activities are for a large part covert in nature; they constitute the regulating activities that shape and guide the observable learning activities (Nelson & Narens, 1990). The consequence is that interactions and interaction sequences with the learning material are ambiguous; there are usually multiple plausible explanations from the perspective of SRL (Jovanović et al., 2017; Phillips et al., 2011). For example, watching the same video twice in the online environment may indicate that the student found the material hard to understand and is therefore re-watching the video (an indication of comprehension monitoring). It may however also be the case that the student did not remember already watching the video (problems with effort regulation), and therefore watches the video twice. The learning activities captured by trace data thus need to be interpreted before they can be labelled as originating from a student’s self-regulating behaviour, which makes interpretation of the results of trace data analyses complicated (Maldonado-Mahauad et al., 2018; Schraw, 2010). This difficulty to interpret learners’ activities in terms of self-regulating behaviour, may thus also compromise the validity of the results obtained in studies that employ this methodology. More insight is thus needed into the how and why of learners’ activities to understand the reasons underlying learners’ behaviour and their meaning in terms of SRL (Cicchinelli et al., 2018; Jovanović et al., 2017; Min & Jingyan, 2017; Phillips et al., 2011). Authors such as Kizilcec et al. (2017) therefore make use of questionnaire data to identify learner activities related to SRL (see also the section on mixed methods). In the sections below, we argue why we think interviews are more suited for this purpose.
A second challenge in measuring SRL with trace data is that some SRL activities take place outside of the online learning environment (Min & Jingyan, 2017). Winne and Jamieson-Noel (2002) for instance argued that scrolling of learners through a text-document indicated planning, planning may however also have been (mostly) a mental activity (Rovers et al., 2019). Veletsianos, Reich, and Pasquini (2016) studied learners’ activities outside of the online learning environment and identified additional activities in three domains. In each of these domains, SRL activities may take place: behaviours at the learners’ workplace (SRL activities: note-taking, making a planning, picking the study location), learners’ activities online, but off-platform (SRL activity: looking for help by browsing the web), and learning activities in the wider context of their lives (SRL activity: dilemma’s in time management due to other priorities). Thus, trace data may be helpful in providing insight into students’ learning behaviours, and these behaviours may be interpreted in terms of SRL, but there is reason to suspect that trace data does not capture all of students’ SRL activity.
Trace data measurement of SRL should thus be supplemented with a measurement method that enables a) understanding the reasons underlying learners’ behaviour, and b) measuring and understanding learners’ SRL activities outside of the online learning environment. In the present paper, we propose that combining trace data with interviews, i.e., using a mixed methods approach, could help to solve these two challenges. In the sections below, we reflect on what mixed methods research entails, and then elaborate on the mixed methods approach of measuring SRL by combining trace data with interviews.
In mixed method research, qualitative and quantitative research methods are combined (Creswell, 2008; Johnson & Onwuegbuzie, 2004). Mixed method research can be classified on two dimensions: the time order decision and the paradigm emphasis decision (Creswell, 2008; Johnson & Onwuegbuzie, 2004). The time order is either sequential or concurrent depending on whether one method informs the other, or if both methods are used concurrently to gather data. The paradigm emphasis decision is either equal status, if quantitative and qualitative methods are of equal importance, or dominant status, if either the quantitative or qualitative data collection is given more weight. By classifying mixed method research on these two dimensions, four types of designs emerge. The most suitable design depends on the purpose of the mixed method study, which could for example be triangulation, complementarity, or expansion. Independent of the design, a mixed method approach will generally provide a more valid measurement of the construct studied than any single method can provide (Creswell, 2008; Johnson & Onwuegbuzie, 2004; McGrath, Martin, & Kulka, 1981).
In the context of SRL, several researchers have employed a mixed methods design in various combinations of time order and paradigm emphasis for various empirical goals (Ben-Eliyahu & Linnenbrink-Garcia, 2015). For instance, Littlejohn, Hood, Milligan, and Mustain (2016) aimed to obtain more in depth information about five sub-processes of SRL that are commonly measured with self-report questionnaires, namely motivation and goal setting, self-efficacy, task strategies, task interest value, and self-satisfaction and evaluation. To do so, learners filled in the questionnaire within a MOOC environment, and a selection of questionnaire respondents was later interviewed. The authors thus combined two self-report measurement methods in a sequential mixed method design, where quantitative data was used as input for the qualitative data collection, with paradigm emphasis on the qualitative interview data (Creswell, 2008; Johnson & Onwuegbuzie, 2004). The interview data yielded several insights, for example that learners with high scores on SRL were less focused on obtaining the certificate compared to learners with low scores on SRL, and more focused on professional development and the relevance of the learning material for their job.
Other work relevant to the present study is the paper by Kizilcec et al. (2017), in which trace data was combined with questionnaire data to identify sequences of learner behaviour correlated to high or low scores on specific SRL scales. This is another example of a study combining instruments in a concurrent time order. The authors correlated learners’ scores on the SRL questionnaire with specific transitions in behaviour. The results included the finding that learners who reported higher SRL skills were more likely to revisit earlier materials instead of starting new materials after completing a part of the course. The authors thus aimed to specify behaviours that correlate with self-reported SRL. As stated earlier, one of the main challenges associated with interpreting trace data in terms of SRL is that learners’ behaviour is sometimes ambiguous. The study by Kizilcec (2017) shows that trace data can indeed be coupled to SRL, but does not completely solve this challenge, because multiple SRL scales were found to be correlated to the same behaviour, leaving open the question how to interpret specific instances of behaviours. Additionally, because their starting points were the scores on the SRL questionnaire, not all behaviour found in the trace data was ‘matched’ with one of the SRL scales. In terms of time ordering in mixed methods studies, we therefore want to propose a sequential methodology that has the trace data as its starting point.
In the present paper, our goal is to build on these earlier mixed methods studies that have aimed to increase our understanding of trace data in terms of SRL. We propose to employ a mixed methods design in which trace data are complemented with interview data. Interviews allow researchers to explore and understand how people behave and think (Alshenqeeti, 2014). In contrast to questionnaires, interviews also allow for follow-up questions that emerge from the dialogue to probe for further information and improve understanding of the learner’s activities (DiCicco-Bloom & Crabtree, 2006). They are therefore suitable to gain insight into learners’ behaviour in a flexible way, both concerning behaviour inside and outside of the online learning environment. While we acknowledge that interviews are not scalable like the use of trace data to measure SRL, this pilot study shows that interviewing a selection of MOOC students already provides a wealth of information on which SRL activities can or cannot be measured. We therefore believe that the effort necessary to interview a range of MOOC students is justified as it will help in the development of trace data as a valid and reliable measure of SRL. In the section below, we reflect on how interviews could be used to address the two challenges of interpreting trace data.
The first challenge associated with interpreting trace data in terms of SRL concerns the trace data’s ambiguity. To understand why a learner performed a specific action at a specific time, the interview technique of verbal protocols, in which a participant verbalizes his or her thoughts and actions (Ericsson & Simon, 1993), could be a solution. Several types of verbal reporting exist, including concurrent reporting (verbalizing during the task), retrospective reporting (verbalizing after the task), and cued retrospective reporting (verbalizing after the task, induced with a cue) (Ericsson & Simon, 1993; Van Gog, Paas, Van Merriënboer, & Witte, 2005). With cued retrospective reporting, learners report on their thoughts and activities after the task, but receive a cue to help them remember the process correctly (e.g., eye movements). Cued retrospective reporting thereby attempts to minimize errors of omission and fabrication, which may occur with retrospective reporting, and without risking to alter the primary process (i.e., reactive invalidity), which may occur with concurrent reporting (Russo, Johnson, & Stephens, 1989; Van Gog et al., 2005). Learners’ trace data could be visualized and presented to them as a cue during an interview to help the learner remember and reflect on his/her learning process. The learner could be asked about specific activities and transitions in the trace data, and thereby be a tool to understand learners’ behaviour in terms of SRL. Of course, the numerous events in a learners’ trace data, and therefore also numerous transitions, make it impractical and unrealistic to have learners explain and reflect on all of these events and transitions in the form of cued retrospective reporting. The researcher therefore has to make a selection of specific events and transitions that are presented as a cue during the interview, so that learners can remember and reflect on their learning process. Combined with follow-up questions from the researcher, the cues could then be used to help learners understand which activities, and which transitions, the interviewer is informing about. By incorporating elements of cued retrospective reporting in such a way, knowledge about specific activities and transitions can be obtained, while also increasing knowledge on the interpretation of these activities, which in traditional verbal reporting is the sole responsibility of the interviewer (Ericsson & Simon, 1993).
The second challenge associated with interpreting trace data is capturing not only the online SRL activities within the online learning environment, but also those outside of it. Again, we argue that interviews could be a tool to address this issue. For this specific challenge, the more traditional form of interviews could be employed, in terms of the researcher asking overarching questions about the participants’ learning process without presenting a cue. For this interview format, three types are distinguished: structured, semi-structured, and unstructured interviews (Alshenqeeti, 2014; DiCicco-Bloom & Crabtree, 2006). Structured interviews are most like a verbal questionnaire and often produce quantitative data (Alshenqeeti, 2014; DiCicco-Bloom & Crabtree, 2006). Since the current aim is to understand learner behaviour and move beyond sole quantitative data, structured interviews provide too little freedom and they are therefore unsuitable for the current purpose. In contrast, unstructured interviews may provide too much freedom. During unstructured interviews, the questions asked often arise during the interview itself and these sessions are thereby more like guided conversations (DiCicco-Bloom & Crabtree, 2006). This approach is valuable when interviewers want to minimalize their influence on the interviewee or when little is known about the topic at hand. However, when measuring SRL, it is important to measure all aspects of the construct. Over time, SRL has been defined in a number of ways, but all entail roughly the same activities that together form SRL activities (Jansen, Van Leeuwen, Janssen, Kester, & Kalz, 2017; Puustinen & Pulkkinen, 2001). To get a full grasp of learners’ SRL, it is worth discussing this predetermined list of SRL activities with the learner (e.g., goal setting, time management). In a semi-structured interview, the SRL activities can be used as topics for which pre-determined questions are created. A checklist can be used to make sure all topics are discussed (Alshenqeeti, 2014). At the same time, a semi-structured interview allows for follow-up questions that emerge from the dialogue to be asked, to probe for further information and improve understanding of the learner’s activities (DiCicco-Bloom & Crabtree, 2006). A semi-structured interview is therefore a suitable method to gather data on learners’ SRL activities outside of the online learning environment, by asking them about each SRL component.
We present a pilot study in which we augment trace data with interview data to analyse learners’ SRL in online courses. Trace data from several online learners were analysed. These learners were later interviewed about the regulation of their learning during the course they were enrolled in. In the interview, cued retrospective reporting was conducted by presenting learners with visualizations of their trace data. In the second part of the interview, learners’ activities outside of the online course environment were discussed in a semi-structured interview format. In the current study, interviews were conducted face to face with learners residing in the same country as the interviewer. However, interviews could also have been conducted online in case learners had resided in different countries, as would often be the case in MOOCs. We present our methodology for a subset of our data, so that we are able to thoroughly explain our procedures for data collection and interpretation. Our aim is therefore to make a methodological contribution to measuring leaners’ SRL in online education. We conclude the paper by discussing the benefits and possible improvements of our approach.
A mixed method research study was performed as a methodological illustration of how to measure SRL in online education, in which quantitative trace data were analysed in conjunction with qualitative interview data (Johnson & Onwuegbuzie, 2004). The interview served two main goals. The first goal was to gain a better understanding of learners’ trace data in terms of SRL. The second goal was to gain insight into learners’ SRL outside of the online learning environment. Therefore, the time order of this mixed method study was sequential; the trace data was analysed and then used as input for semi-structured interviews. Dominant status (paradigm emphasis decision) was given to the interview data, as we were interested in the additional information that can be extracted from adding interviews to trace data.
Four students of the same Dutch university were interviewed. At this university, students were offered the opportunity to take a traditional exam, with a fixed time and location, after following a MOOC. If they passed the exam, they would be given elective credits. The four interviewed students all successfully took such an exam and thus received elective credits. This form of online education is known as a Small Private Online Course (SPOC). Commonly, SPOC students form a small subgroup within the MOOC environment. They are for instance offered additional help from a tutor and they can discuss learning with other SPOC learners in a separate course forum. Such distinctions between SPOC learners and regular MOOC learners were not present. The educational materials all had to be accessed through edX (an online learning platform). The online learning experience of those studying at the university (current participants, SPOC learners) was identical to the learning experience of those not studying at the university (MOOC learners). The autonomy offered to SPOC learners was therefore also identical to the autonomy offered to MOOC learners. While the opportunity to earn elective credits may have impacted the motivation of the SPOC students, the courses were not part of the formal curriculum of any of the students and therefore not compulsory. The impact of the credits on course motivation was therefore likely to be limited.
All students that registered for an exam in the Spring of 2018 were invited to be interviewed. Five students indicated they were willing to be interviewed, and gave consent for the analysis of their trace data. One student had taken the exam already in the Fall of 2017 and was therefore excluded. The data of four students is therefore used (1 male; mean age = 22.0, range 19-24). The students were interviewed by the first author. Participants received a 20 euro gift voucher for a large online warehouse as compensation for their participation.
All learners’ activities in the online learning environment were automatically stored, leaving a trace of their learning behaviour (hence the term ‘trace data’). This trace data included a time stamped log of all their activities, including videos played and paused, self-test questions answered correctly and incorrectly, and exam questions answered correctly and incorrectly. As the data were time stamped and related to a learners’ user id, the order in which a learner engaged with the learning materials is known. The trace data can be analysed in a number of ways, for instance by looking at absolute or relative frequencies of activities, transitions from one activity to another, or patterns of activities per session or over the entire learning period. Depending on the aim of the research, different analyses are suitable. For instance, to identify activities or sequences of activities related to learner achievement, analyses counting activities and sequences would be fitting. Currently, the aim is to gain insight in participants’ learning processes and to identify potential SRL activities present in their trace data. For this aim, the trace data of participants’ was analysed in a number of ways. The timing of learners’ study sessions was analysed, indicating when and how long a learner studied in the online course environment. Furthermore, attention was paid to the frequency of activities and potential skipping of learning activities. Finally, the order of learner’s activities in the online learning environment was inspected.
To stimulate learner recall of their learning activities, a visualization of the learning process was considered most suitable, since it provides learners with an overview of their learning process and such a visualization can be understood rather easily without prior knowledge of the data gathered. Therefore, for each participant, a visualization of the learners’ activities within the online learning environment was created. To aid understanding of these trace data visualizations, an excerpt of the transition diagram of P4 is presented in Figure 1. More information about the analysis of the trace data, and the interpretation of the transition diagrams can be found in the sections “Analysis” in the Method and “Trace data interpretation” in the Results.
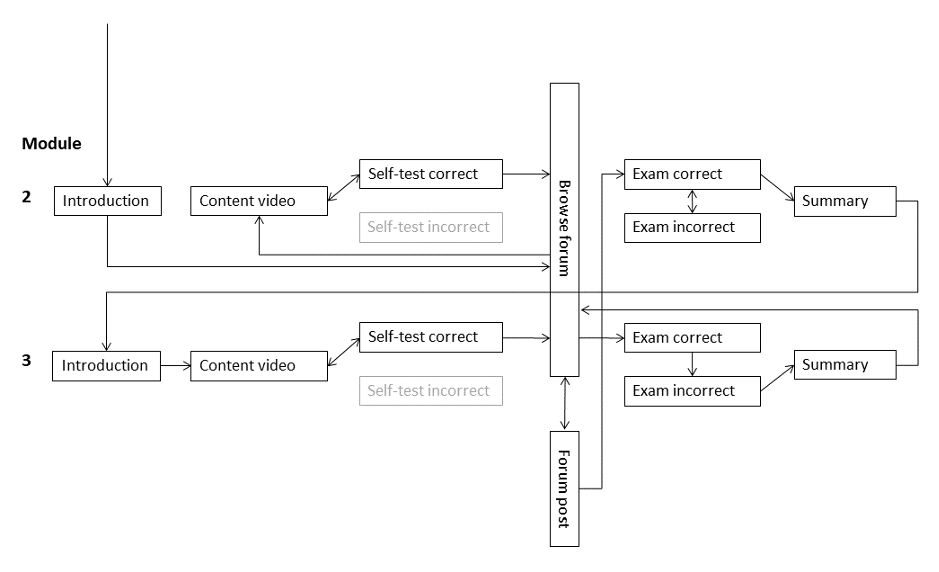
Figure 1. Excerpt of the transition diagram of P4. The transition diagram visualizes the order in which P4 engaged with the learning materials of module 2 and 3.
A semi-structured interview guide was developed with a descriptive/interpretive focus to gain insight into the explanations of learners’ online behaviour and their self-regulated learning outside of the online learning environment (McIntosh & Morse, 2015). A visualization of learners’ trace data was used during the interview as a cue for recall of the learning process. The interview guide consisted of four segments and is presented in Appendix A.
First, the interviewer explained the interview goal and asked several introductory questions. The introductory questions included asking the participant about the title and topic of the SPOC the student followed and how the participant had learned about the opportunity to take a MOOC for credit. The questions were constructed to learn some basic information about the participant and to create rapport between the interviewer and the interviewee.
Next, learners’ activities were discussed at a micro level, meaning that learners were asked about their behaviour in the learning environment. The aim was to gain an SRL-themed explanation for learners’ trace data. To help learners remember their learning process, a visualization of their trace data was presented to learners as a cue (see Figure 1 for an example). This segment thereby had similarities to cued retrospective reporting. However, not all activities and transitions in the visualization were discussed, not only because the learning process was simply too complex to do so, but also because some of the activities were conducted months before the interview. More importantly, the aim of the interview also was not to understand all transitions and activities, but to gain an understanding of learners’ overall learning process, how they managed their learning, and the reasons underlying their learning activities. Learners were therefore not only presented the trace data visualization, but were also interviewed about their learning process in general and about the way they engaged with the specific elements of the course (e.g., introductory videos, content videos, self-test questions, exam questions), to better understand with what intent the learners engaged with these materials (e.g., content learning, comprehension check). Learners were furthermore interviewed about the timing of their learning sessions (i.e., when they worked on the course), to understand the (ir)regularity of their studying and their time management.
Third, learners’ activities were discussed at a macro level. Learners were interviewed about SRL activities not visible in the trace data and their behaviour outside of the learning environment. Learners were for instance asked about the location where they studied, potential help-seeking, and their planning. It was made sure that all aspects of SRL, as described in the articles of Jansen, van Leeuwen, Janssen, and Kester (2017) and Puustinnen and Pulkinnen (2001) were discussed with the participant at a micro and/or at a macro level. Finally, learners were interviewed about any challenges they had encountered during learning, and if they had suggestions for improving the course, especially related to SRL.
The interviews were conducted in Dutch as it was the mother tongue of both the interviewer and all interviewees. The interviews lasted between 1 hour and 1 hour and 15 minutes each. At the start of the interview, participants signed an informed consent for the interview to be audio and video taped. The video camera was directed at the table to record the trace data materials shown to participants and any pointing to specific activities and transitions on these materials (e.g. “during this module”, or “when I moved from here to here”).
After registering for a SPOC exam, students were emailed information about the present research study. They were given the option to supply their contact information if they were willing to be interviewed. Students were informed that their trace data would be analysed if they indicated their interest in participating. The trace data of interested students was analysed a) to determine the amount of learners’ activities in the online learning environment, b) to determine the length and amount of learning sessions, and c) to create a transition diagram of students’ learning. The interview was structured by following the interview guide described above. Learners could be invited to participate in the interviews only after registering for the SPOC exam, and only after agreeing to participate could their trace data be analysed. As trace data analysis itself is time consuming, interviews were scheduled approximately two months after the SPOC exams.
The trace data was inspected to gain knowledge on the timing and length of learners’ sessions, the frequency of their activities, and the order of their learning activities. The activities of each learner were visualized in a transition diagram. While the participants followed different courses, the main elements of all courses were the same. Therefore their transition diagrams also contained the same elements. Per module, the following activities were visualized in the transition diagram: introduction video, content video (there were usually multiple content videos per week, interactions with either of the videos were aggregated to this label), self-test question correct, self-test question incorrect, exam correct, exam incorrect, and summary video. Furthermore, browsing the forum and posting on the forum were visualized in the transition diagram, but on a course level and not on a module level. Next, each learner’s transitions were added to his course model. As only a small sample of learners participated in the current study, this was done by hand. Furthermore, per learner an overview was made of when the learner engaged with the course. Additionally, a description was made of the overall learning process of the student, including any activities or transitions that were considered remarkable or interesting. It was then attempted to distil SRL activities from the trace data analyses.
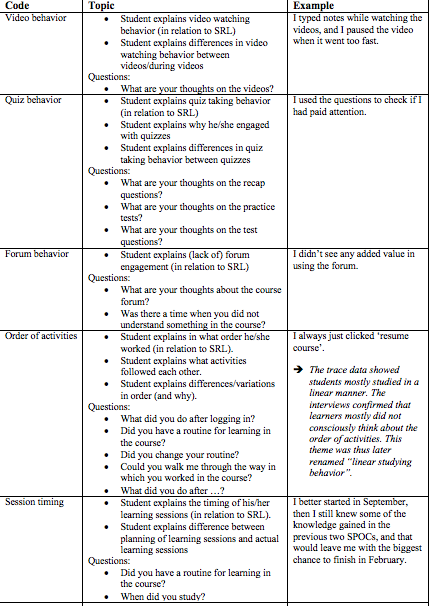
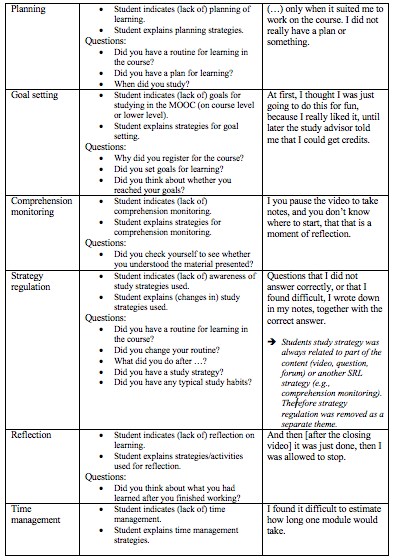
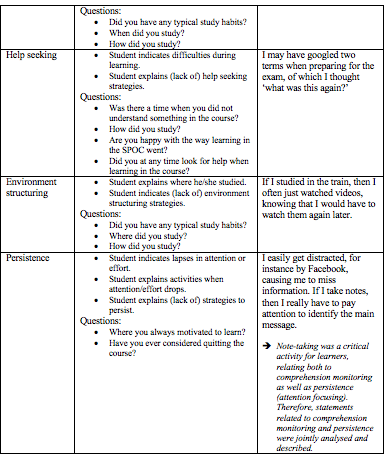
The transition diagrams visualizing the learning process of the participants were used during the interviews as a cue for recall (see Figure 1). After conducting the interviews, they were first transcribed. Next, statements that helped interpret the trace data, especially in terms of SRL, and statements that indicated SRL activities not visible in the trace data were identified in the transcripts. Interview codes were created mostly top-down, based on the SRL activities that were also used to structure the interviews. Additional codes could be created during coding if the SRL activities listed beforehand were insufficient saturation (Morse, 2010; Strauss & Corbin, 1994). The SRL statements were then labelled with the trace data or SRL activity they provided information about. For each theme, statements of the different participants were then grouped and a description of the information gathered from the interviews was written per theme. The coding scheme can be found in Appendix B.
The results are presented in three parts. First, case descriptions of the four participants are given. The case descriptions contain, per participant, information about the course followed, their study intentions, and the timing of their learning sessions. Next, we present the trace data of one of the participants (P4), and attempt to interpret the trace data in terms of SRL. While the trace data provide an objective overview of the learners’ activities, no definitive conclusions regarding SRL activities could be made based on trace data alone for P4, nor for the other participants. The trace data of P4 are used to illustrate the data available and to illustrate the opportunities and challenges of using the data, especially for understanding and interpreting the data in terms of SRL. Last, the interview findings are presented in which we focus on the additional insights gained from interviewing learners in addition to analysing their trace data. We first indicate in what way the interviews improved our understanding of the trace data. Second, we describe the SRL activities of learners not visible in the trace data.
The four interviewees followed different SPOCs. The exams for all SPOCs took place mid-February. Below, more information per participant is provided about the course they followed, their study intentions, and the information obtained from their trace data.
3.1.1. Participant 1 (P1).
P1 followed the course ‘Food access’ which she finalized with a grade of 7.5 (out of 10). She had time to spare next to the regular curriculum which she wanted to utilize in a meaningful manner. She started the SPOC out of interest in the topic of the course, and decided on taking the exam after completing a large part of the course. The SPOC was her first experience with a fully online course. In total, 1146 activities were logged for P1, distributed over 20 days in a time span of five months. Figure 2 shows the timing of the learning sessions.
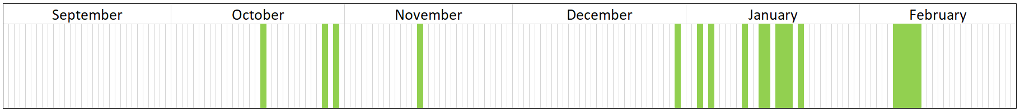
Figure 2. Timing of learning sessions P1. Green bars indicate activities were logged on that day.
3.1.2. Participant 2 (P2).
P2 followed the course ‘Food risks’ which he finalized with a 8.0. The SPOC was part of a so-called ‘micromaster’ which contains three SPOCs which together serve as a replacement for a traditional campus-based course. P2 had already taken the other two courses in the micromaster, and thus started this SPOC with the intention to finish the course, pass the exam, and receive the credits. In total, 1407 activities were logged for P2, distributed over 28 days in a time span of six months. Figure 3 shows the timing of the learning sessions.
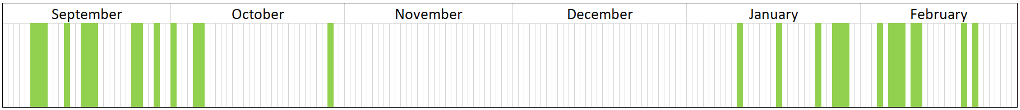
Figure 3. Timing of learning sessions P3. Green bars indicate activities were logged on that day.
3.1.3. Participant 3 (P3).
P3 followed the course ‘Food risks’, the same course as P2, which she finalized with a 8.0. P3 was abroad for a month during the study year, and planned on attending this SPOC and two others to gain elective credits while away. However, as she had much less time available for studying while abroad, and there were technical difficulties with the internet connection, she did not complete any of the SPOCs while abroad. After returning home, she completed the SPOC on ‘Food risks’; the other SPOCs were dropped. This was her first experience with studying online. In total, 1012 activities were logged for P3, distributed over 22 days in a time span of two months. Figure 4 shows the timing of the learning sessions.
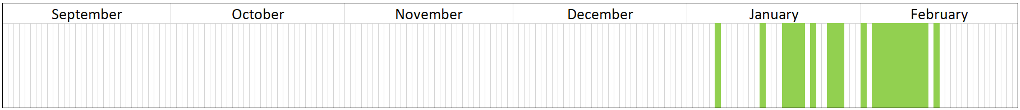
Figure 4. Timing of learning sessions P3. Green bars indicate activities were logged on that day.
3.1.4. Participant 4 (P4).
P4 followed the course ‘Animal behaviour’, which she finalized with a 8.5. She started the course out of interest in the topic, and only later learned about the opportunity to take an exam and receive elective credits. It was her first experience with studying online. In total, 1296 activities were logged for P4, distributed over 14 days in a time span of 6 months. Figure 5 shows the timing of the learning sessions.
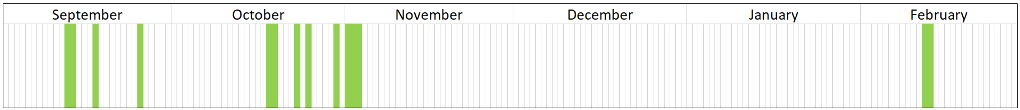
Figure 5. Timing of learning sessions P4. Green bars indicate activities were logged on that day.
Before interviewing the students, their trace data were analysed. For all four participants, the trace data provided a good overview of their learning process, and activities could be identified that might be indicate of SRL activities. However, interpretations of the data were ambiguous for all four participants. To illustrate the information gathered from the data, a description of the trace data gathered for P4 is provided, including potential SRL interpretations.
When analysing the activities stored in the trace data, the trace data for September only showed interactions with the introductory module of the course and the first few videos of module 1 (the first video with actual content). During the sessions in October and November the learner completed all other course materials (videos, readings, exams and assignments). In the two sessions in February, right before the course exam, P4 engaged linearly with the introduction and content videos of all modules. This may indicate strategic studying behaviour. It is however not known if the participant also used other materials to study for the exam. The finding that she completed all materials well before the exam may indicate good time management abilities.
In Figure 1 (in the Method) an excerpt of the transition diagram of P4 was presented, showing the activities of P4 in modules 2 and 3 of the course. The excerpt is exemplary for the entire learning process of P4. P4 engaged with the videos, self-test questions, and exam questions mostly in linear order. However, watching videos was regularly alternated with browsing and posting on the forum. The regular forum interactions of P4 may indicate help seeking. The trace data of the video interaction activities of P4 includes frequent pausing (and then continuing playing) videos, especially with content videos. The trace data furthermore regularly includes seeking a specific time point in the video. Pausing the video may indicate note-taking, while seeking in the video may indicate that she noticed a gap in her understanding (comprehension monitoring) or missing notes and that she then attempted to gather the missing knowledge. Finally, as is also the case in the excerpt of the transition diagram presented in Figure 5, the participant answered most self-test questions correctly. In the few cases that she answered a question incorrectly, P4 first answered the question correctly before continuing with other course materials. However, P4 did not consult the associated course materials before re-answering the question, at least not in a way visible in the trace data. She may have guessed the correct answer, as all self-test questions are multiple choice, or she may have consulted her notes if she made them. This activity order cannot be interpreted based on trace data alone.
In sum, the trace data provide information on the learning process of P4. However, understanding the reasons underlying the activities, and interpreting them as the result of SRL activities, is not possible without ambiguity remaining. The trace data analysis results in assumptions of SRL activities and potential explanations, but doubt on the accuracy of these explanations remains. This was no different when attempting to interpret the trace data of the other three participants. The trace data description of P4 is therefore an illustration of the difficulties in using trace data to measure SRL for all participants. In order to measure and understand learners’ SRL, more information was necessary for all four participants. Below, we describe how the four interviews extended and improved our understanding of learners’ SRL activities.
In the following sections we present several strands of information which were collected by adding interviews as a measurement method to trace data analyses. While we by no means imply that our results provide a complete description of all potential SPOC learners, our results do show the benefit of incorporating interviews, instead of solely analysing trace data to measure learners’ SRL. Our results can be considered an illustration of the results that can be obtained from the methodological approach advocated in this paper. The findings are structured around two themes: (1) interview findings that improve our understanding of the trace data, and (2) interview findings that teach us about learners’ SRL outside of the online learning environment. Quotes of the interviewees are incorporated to support our findings.
3.3.1. Understanding trace data.
In the first part of the interview, participants were questioned about their learning activities in the online learning environment. The insights they provided have led to a better understanding of the how and why of learners’ activities in the online learning environment.
Linear studying behaviour. The trace data of all participants showed a rather linear approach to learning in the SPOCs; meaning that the participants – to a large extent - worked with the course materials in the same order as it was designed by the course designers. In the interviews, participants explained why they approached their learning in a linear fashion. Linear studying was more a habit out of convenience than a conscious decision. As P3 commented “I always just clicked ‘resume course”. P1 said “it seemed logical that they would have a structure for offering materials”, which was also given as a reason for linear studying by P4. P4 furthermore added “By studying linearly, you know what you have done and you don’t need to search for where to continue. You know where you left off and what you still need to do”. Linear studying thereby thus had benefits for monitoring progress and made it easier to continue working at a later moment in time. In conclusion, the interviews provided an explanation for why the students followed a linear, regular pattern while studying in the SPOCs.
Lack of engagement with the course forum. P4 was the only participant who regularly engaged with the course forum. She introduced herself on the forum, posted her answers to questions when invited to, and asked for help on the forum. The other participants hardly engaged with the course forum, or not at all. When asked about the course forum their first response was that it did not seem useful to them (P1 “I didn’t see any added value in using the forum”); they followed the course for their own learning, and were not interested in the experiences of other learners around the world. The forum however does not solely have a social function; it can also be used for seeking help. All participants indicated that they had had some problems with understanding the course materials. Their barriers to asking for help on the forum included not knowing how long it would take to get an answer, finding it too much effort to type out mathematical formulas, and being too stubborn (P2 “I was too stubborn to share my questions, I would then just look back at the video once more”). In sum, the interviews helped to understand the lack of help seeking on the forum indicated by the trace data. The interviews also revealed that visiting the forum and posting questions might have been an effective strategy for learners in some cases.
Engagement with videos. The trace data showed that the participants watched (almost) all videos. The trace data also showed regular, short pausing of the videos. This likely indicated pausing to take notes, which was confirmed in the interviews, as P1 said “I typed notes while watching the videos, and I paused the video when it went too fast”. The notes were useful for studying for the exam, as all participants indicated using their notes as their main study material for the exam, only supplemented with questions and videos when their notes were not fully clear. The interviews thus supported the hypothesis derived from the trace data: short pauses while watching the videos were caused by students taking notes.
The courses contained different types of videos. Each module consisted of an introductory video, multiple content videos, and a summary video. Participants indicated having different approaches for these different types of videos. They watched the introductory and summary videos “in a more laid back manner” (P3). For instance, “the introductory videos were really an introduction, which meant that I often did not take serious notes” (P2) and “I watched the summary videos, but I didn’t do anything with them. I had just seen all the content, so the summary did not really add anything” (P4). While note-taking was thus a common activity for the content videos, it was much less so for the introductory and summary videos. This difference can also be detected in the trace data, as the content videos were paused more often than the introductory and the summary videos.
However, the lack of note-taking does not imply that the videos were not useful for the participants. While some watched the introduction and summary only because they feared they would miss something important if they did not (“I will watch them [the introductory videos] anyway, because maybe they will say something important”, P1), the videos helped participants orient on what was to come and to reflect on the content of the past module. As P4 said about the summary videos “If something was mentioned that I did not remember hearing about, I looked it up in the previous videos. Even though I was already putting my stuff away while the summary video was playing”.
Engagement with questions. Participants were clearly aware that answering the self-test questions helped them monitor their comprehension. P4 indicated “I used the questions to check if I had paid attention, and that was almost always the case”. Self-regulated learning requires learners to be adaptive in their learning strategy, especially when they face adversity. It is therefore interesting to better understand learners’ strategies when they find questions difficult and/or answer questions incorrectly. These strategies are not (always) visible in the trace data. As P1 explained “Questions that I did not answer correctly, or that I found difficult, I wrote down in my notes, together with the correct answer. So that I would understand that information the next time I studied”. P2 had a different strategy. He tried to answer the question. If his answer was incorrect, he first looked back in his notes to work out what went wrong. If that did not answer his question, only then did he go back to the associated video. The trace data thereby thus only showed a part of the strategy of P2 to deal with wrongly answered questions. In sum, the interviews helped to further enlighten the SRL processes students were engaged in; they specifically shed light on learners’ engagement with self-test questions and the relation between answering questions and comprehension monitoring.
Timing of sessions. The timing of learners’ activities (Figures 1-4) was diverse; some learners worked on the course for an extended period of time and others only had a few, very active, days. Some participants also showed a burst in activity the days before the exam (see Figure 1 and 4). The interview provided more information about the timing of learners activities. For instance, P2 spread working on the course materials over a large portion of time. He explained “I knew I had to take this course next to other courses at some point (...) so I better started in September, then I still knew some of the knowledge I gained in the previous two SPOCs, and that would leave me with the biggest chance to finish in February”. For P1 other obligations, such as campus-based courses, resulted in large stretches of time between working on the course. P3 had planned on studying online abroad, but as she had less time available than expected, studying was postponed until she was back in The Netherlands. The trace data show that the first couple of sessions (while abroad) were much shorter in length than the later sessions. The sprint in studying in the two weeks before the exam is thereby visible in the trace data (see Figure 3). In these cases, the interviews helped understand learner behaviour and provided explanations for the irregular timing of participants’ learning sessions.
Associated with the timing of learning sessions are different segments in learners’ studying. For some participants, the trace data showed a clear distinction between completing the course materials and, later in time, studying for the exam. This distinction was visible in the timing of the sessions (paced studying throughout most of the course, and then a few days of high intensity right before the exam), but the ordering of activities also showed a distinction. The participants completed the course materials in a linear fashion. After finishing all materials, they looked back at specific materials: they moved from content video to content video, ignoring the introductory and summary videos, and viewed only some of the questions. The assumption that these behaviours were associated with different segments of the study process could be verified in the interviews. When discussing the exam preparations, P1 commented “I looked at the exams again, to see what kind of questions they asked. And for the things that I did not understood, what I found complicated, for those things I watched the videos again.” Here too, the interviews helped to better understand the difference in behaviour of the participating students between the phase where they followed the course and the phase where they were studying for the exam.
3.3.2. SRL outside of the online learning environment.
The second part of the interview focused on learners’ SRL outside of the online learning environment. The interviews thus supplemented the trace data by focusing on activities for which no indicators can be found in the trace data.
Planning and goal setting. Participants’ intentions for taking the SPOC differed: while P2 needed the credits associated with the course, P3 was interested in the credits but they were not necessary, and P1 and P4 took the course completely out of general interest and only decided on taking the exam after completing part of the course. However, besides the overall goal of course completion that all participants had sooner or later in the course, they did not set goals. Furthermore, they also did not have any plans, or had general plans which they failed to stick to: “I knew I wanted to go through the course linearly, but only when it suited me to work on the course. I did not really have a plan or something (…) I had so much time to finish the course, I just worked on the course when it was convenient” (P1) or “I knew I would not be able to finish a module per week, so I tried to finish half a module per week, but that also did not work and I ended up just studying an hour now and then, without any clear structure”(P2). All participants finished their SPOC successfully, suggesting that the courses are attainable also without a clear planning. However, participants’ learning might have benefitted from better planning and goal setting. In any case, trace data alone are insufficient to determine which students are in need of support for planning and goal setting. More information, for instance through interviews, is needed.
Comprehension monitoring and attention focusing. Participants indicated that they engaged in note-taking not only to improve their remembrance of the information presented, but also to support comprehension monitoring and attention focusing. Note-taking was thereby an important cognitive activity for participants. As P2 indicated “If you pause the video to take notes, and you don’t know where to start, than that is a moment of reflection; maybe you have to start over or continue the next day”. P1 explained “I easily get distracted, for instance by Facebook, causing me to miss information. If I take notes, then I really have to pay attention to identify the main message”. The trace of pausing videos could be associated with taking notes. This trace may thus be interpreted not only as a cognitive activity (i.e., taking notes), but also as a metacognitive activity (e.g., comprehension monitoring) or attention focusing. The interview data allowed for the validation of the interpretation of pausing videos as a self-regulated learning activity.
Reflection on learning. The trace data indicated that participants often ended a session with an exam and the associated closing video, which may indicate reflection. The interviews provided evidence that participants ended after an exam on purpose “If I was working on the course, then I wanted to complete the whole module” (P4). Participants were asked to what extent they reflected on their learning strategies and their progress, for instance at the end of a learning session. Participants indicated hardly any reflection: “I think it was just a closing [video] indeed, and then it was simply done” (P3) and “And then [after the closing video] it was just done, than I was allowed to stop” (P4). Based on the trace data alone, it could not be established of learners’ engaged in the SRL activity reflection; it could only be established that they engaged in activities that may be associated with reflection. In the interview, learners could be directly asked about any reflection on their learning. The interviews provided clear information that the learners did not (consciously) engage in reflection.
Time management. Participants repeatedly indicated problems with time management. Participants did not orient themselves on the amount of work per module: “I found it difficult to estimate how long one module would take. So if I planned on doing modules 3 and 4 that day, I had no clue how much time that would cost me”(P3). The lack of orientation led to an underestimation of the amount of work involved: “I don’t know how long I expected that it would take. [On the website] it said that it would take 6 to 8 hours per week. But I thought ‘only videos, that can’t take that long” (P1). In addition, P4 indicated underestimating the time she would need to finish the course, as a result of her prior experience with studying, since “I thought that – as I am already enrolled in university – I know how to study, so I will need a few hours less than they say”. Consequence of learners’ lack of planning and insufficient time management, was that they were stressed and pressed for time when finishing their course; “eventually you get stressed and that is a shame, because it is absolutely not necessary” (P3). While the trace data showed bursts in activity in de days before the final exam, this could not be interpreted as problematic. The interview data allows us to better understand learners’ time management and taught us that learners underestimate the amount of time needed.
Help seeking. Participants hardly used the course forum, as already described in the section ‘lack of engagement with the course forum’. During the interviews, it became clear that learners overall hardly ever needed help. When asked if there was material that was hard to comprehend, learners responded with “No, I thought it was all just clearly designed” (P2) and “The theory was not complicated” (P3). There was limited external help seeking, as P3 indicated “I may have googled two terms when preparing for the exam, of which I thought ‘what was this again?”. However, it also became clear that participants sometimes did need help when they were unsure about the answer of an exam question. Participants found different solutions, including re-watching videos, or skipping the material under the assumption that one would not need to understand everything in order to pass the course (P3 “I thought, if I understand seven out of eight [modules], then it must be alright.”). It was already indicated in the section on forum engagement that P2 preferred re-watching the videos over posting on the forum, and P4 indicated: “I would look back in my notes, or in the transcript, or in the video, in that order”. In sum, the trace data indicate very little engagement with the course forum, and the inference that learners are not searching for external help appears to be correct. However, learners do occasionally need help, and the interview results show a number of solutions employed by learners to seek help outside the course forum.
Environment structuring. Participants consciously decided on where they studied for their SPOC and they made use of the autonomy in study location offered by online education (“I appreciated that I could study everywhere. That you were not bound to a specific location”, P1). P1 and P2 studied in varying locations: “I sometimes worked on the course when I went home to my parents, sometimes in my student dorm room, and sometimes in the university library” (P1) and “I switched between the university library and at home. (…) And if I am in the train, I try to do something useful, so then I also regularly worked on it” (P2). P2 further clarified “If I studied in the train, then I often just watched videos, knowing that I would have to watch them again later (..) or I watched specific videos a second time”. Studying in the train was thereby in addition to studying at home or the university library, not a replacement. P3 and P4 deliberately choose to study at home, as P3 remarked “I like having the option to study at home, since I can then make a nice cup of tea when I want to, and I am not surrounded by annoying people the way you are in the university library”. Overall, the interview data provided clear information for all participants on where they studied, and the reasons underlying their choice of location. As environment structuring cannot be extracted from trace data, but is part of SRL, the interviews helped get a more comprehensive measure of learners self-regulated learning.
In this study, we used a mixed method approach combining trace data and interview data to study SRL in online education. To be successful in online education, learners must be able to self-regulate their learning due to the autonomy offered to them (Azevedo & Aleven, 2013; Beishuizen & Steffens, 2011; Broadbent, 2017; Hew & Cheung, 2014; Wang et al., 2013). Accurate measurement of learners’ SRL is necessary to determine which students are in need of support and how to best offer support. Trace data have been used previously to measure learners’ SRL, since trace data can be gathered unobtrusively from all learners (e.g., Cicchinelli et al., 2018; Hadwin et al., 2007; Kizilcec et al., 2017; Van Laer & Elen, 2018). We identified two main problems with measuring SRL with trace data, which we tried to solve by combining trace data with interviews in a mixed method study.
First, the interviews helped to remove ambiguities in the interpretation of the trace data. For instance, all learners indicated that the short pauses in watching the content videos were used for note-taking, and that their viewing behaviour of the introduction and summary videos was markedly different (i.e., more laid-back) than that of the content videos. The interviews were thereby helpful for accurate interpretation of learners’ trace data. Using interviews to interpret trace data could be a valuable addition to existing studies that aim to measure SRL in online education. For instance, interview data could be useful in studies that correlate SRL activities measured with questionnaires to sequences found in trace data, as reported for example in the study by Kizilcec et al (2017). in that study, sequences of activities could be related to multiple SRL constructs, thus leaving open the option for multiple SRL interpretations. In such situations, interviews may be helpful to determine the correct SRL interpretation of transitions for individual learners. Interviews may also be useful to determine accurate indicators of SRL activity in trace data. Cicchinelli et al. (2018) defined trace data indicators for several SRL activities. The frequency with which these indicators were present in learners’ trace data was used as a measure of learners’ engagement in SRL activities during learning. In such situations, in which trace data is used to measure SRL activity, it may be useful to conduct interviews before collecting trace data to support the selection of accurate trace data indicators of SRL activity.
The second problem identified was that learners’ behaviour outside of the learning environment is not captured in trace data. The interviews helped gain insight into learners’ SRL activities that occur outside of the online learning environment. Learners for instance indicated that they studied in different locations, and some learners’ study strategy also differed based on their study location (e.g., only re-watching videos in the train). The interviews showed that while some SRL activities occur both inside and outside of the online learning environment (e.g., comprehension monitoring)., others solely take place outside of the online learning environment (e.g., environment structuring), This finding means that researchers might draw incorrect conclusions about how learners self-regulate their learning if they only rely on measurements of learners’ SRL activities within the online learning environment. Researchers may for instance conclude that learners who do not take self-test questions do not monitor their learning. However, learners may also engage in note-taking to monitor their comprehension of the key points; behaviour which is not visible in trace data directly. Furthermore, the interviews showed that learners who are able to self-regulate their learning inside the online learning environment, may still struggle with SRL outside of the online learning environment. It may then incorrectly be assumed that these learners are not in need of SRL support. Many learners however struggle with time management due to conflicting responsibilities in the rest of their lives (Hew & Cheung, 2014); an issue that is hard to measure with trace data only. Measurement of learners’ SRL activities outside of the online learning environment as we have done with interviews is thus important to obtain a complete overview of SRL activities and to provide learners with adequate support.
Using trace data in combination with interview data in a mixed method study thus proved a useful approach for addressing the two identified problems with using trace data as a mono-method to measure learners’ SRL. However, interviewing learners is much more time consuming and labour intensive than collecting trace data. The main benefits of trace data, unobtrusive collection and measurement of all learners, no longer apply when combining trace data with interviews. While we currently consider it important to combine trace data with another data source due to the problems described, we also acknowledge that combining trace data with interviews is not attainable at a large scale. Fortunately, we also do not consider this necessary, as we see other potential solutions for the identified problems in the future.
After repeated multi-method studies in which trace data are combined with interviews for larger, and more diverse samples, it will likely be possible to interpret part of the trace data unambiguously in terms of SRL. The trace data variables that can be interpreted reliably in the future may then be used without combining them with another data source. For instance, answering test questions indicated comprehension monitoring for all learners in this pilot. If this interpretation is replicated, then quiz taking may be used as an indicator for the SRL activity comprehension monitoring. Researchers who are interested in the measurement of the SRL behaviours that can be interpreted reliably from trace data, will thus be able to use trace data as a mono-method in the future. Furthermore, in studies in which trace data is the only available data source, it is then clear what trace data can be interpreted validly and reliably. Hereby, we argue, we will be able to reap the benefits (and simultaneously: be aware of the limitations) of unobtrusive, large-scale measurement of SRL with trace data in the future.
As learners’ behaviour outside of the online learning environment is not captured in trace data, we will never be able to measure this behaviour with trace data alone. Repeated measurement of learners’ behaviour outside of the learning environment could help determine what SRL activities are overlooked when solely measuring SRL with trace data in online education. If trace data are then used as a mono-method in research, it will be clear what aspects of SRL are not measured. Additionally, the measurement of learners’ SRL activities outside of the learning environment will allow for categorization of these activities if enough learners, from diverse samples, have been interviewed. It is therefore anticipated that a questionnaire to measure learners’ SRL activities outside of the learning environment can be developed based on the united interviews findings of multiple studies. While questionnaires measuring learners’ SRL outside of the learning environment already exist (e.g., Barnard, Lan, To, Paton, & Lai, 2009; Jansen et al., 2017), these have been developed based on theoretical knowledge of SRL and experiences of learners in offline learning environments. Participant input to make sure the right SRL behaviours are inquired in the questionnaire is therefore currently missing and would make a worthwhile addition to the questionnaires to increase their validity. While measurement of learners’ SRL outside of the learning environment with a questionnaire is not unobtrusive, questionnaire data can be gathered on a large scale much more easily than interview data.
The results of this study have improved our understanding of learners’ activities in SPOCs. By focusing the interviews on both participants’ reflections on (1) the trace data itself and (2) their SRL outside of the learning environment, we were able to better understand both aspects of learners’ activities. In order to measure both the micro and macro aspects of learners’ activities, we made use of interviews, since they allow asking questions on a range of different granularities. We feel this is valuable, as it provided a richer understanding of learner behaviour. However, as it was the first study of its kind within this domain, a reflection on the methodology used is in order.
When combining trace data with interview data, three issues that need specific attention can be identified. The first issue concerns the selection of participants. As is the case in all research, the sample included influences the results found and the generalizability of those results. The interviews conducted in the current study formed a pilot sample to show the benefits of the presented methodology. If researchers want to use our proposed methodology to draw conclusion and add to theory development, they should attempt to obtain a larger sample. The current sample of four interviewees was rather homogeneous in characteristics, yet the interviewees already differed in their reported SRL. This diversity indicates that a much larger, and more diverse, sample is necessary to determine valid interpretations of learners’ behaviour. Likely, an iterative approach of interviewing and analysing data is necessary to reach data saturation (Morse, 2010; Strauss & Corbin, 1994), especially when one is interested in measuring and understanding the SRL of a more diverse group of learners. Since trace data provide insight in learners’ learning process, analysis of the trace data of learners may be helpful for purposive sampling (Robinson, 2014). Trace data may be used to identify a diverse set of learners to be interviewed or to identify specific cases one is interested in, such as learners who quit the course early or who finished the complete course. Purposive sampling may thus contribute to reach data saturation.
The second methodological issue concerns the time span between the learning activities and the interview. Interviewing students early, potentially even during the course they are attending, results in richer data that is likely more reliable than verbal reporting collected later. Retrospective reporting may lead to both errors of omission (forgetting SRL activities) as well as to errors of fabricating (reporting SRL activities that did not take place, or were not as deliberate as they are reported; Russo et al., 1989). Nevertheless, waiting with selecting interviewees until the course is over as happened in this study also has two advantages. First, learners’ activities in the course are then not influenced by the interview, which may be the case when interviewing during the course (reactive invalidity; Russo et al., 1989). Second, trace data for the full course can then be used to select an adequate sample. For instance, learners that quit the course cannot be selected early on, as they may still continue learning in the SPOC or MOOC (much) later. In this pilot, the time between studying and the exam on the one hand, and the interview on the other hand, was two months. This likely hampered learners’ recall of their activities and the reasons underlying their activities. The transition diagrams we made for every participant alleviated this problem to some extent, as they helped interviewees remember their learning activities (i.e., cued retrospective recall). However, we acknowledge that approaching potential interviewees at an earlier point in time would likely have resulted in richer data.
The third methodological consideration influencing our findings, is the presentation of trace data to participants. The trace data visualizations are used as a cue for cued retrospective reporting. The formatting of the cue, and the information that is and is not included, likely influences learners’ reporting. Researchers should therefore carefully decide on the formatting of their trace data cue and be aware of the consequences of their decisions. Trace data visualizations in the form of transition diagrams, as they were used in the current study, helped learners to remember all activities present in the course. They furthermore helped learners to explain both the linearity in their learning behaviour as well as the deviations in this linearity. However, the transition diagrams are limited by the fact that if multiple arrows move out of an activity, one cannot determine which one of the out arrows should be followed at which moment in time. For instance, in Figure 5 the learner may have posted on the forum every time after browsing the forum, however, the learner may also have posted only once in response to browsing. This difference is not visible in the static transition diagram. In this study, the listing of all activities was used as supportive information during the interviews. A dynamic transition diagram, in which arrows are added over time, thereby including temporal information, could solve this problem.
We have presented a methodological approach to measuring SRL in online education by combining trace data with interview data. While there is surely room for improvement, for which we have provided suggestions in this discussion, the results of this study show the potential of this combination of methodologies. Currently, trace data are already interpreted in terms of SRL (e.g., Cicchinelli et al., 2018; Fincham et al., 2018; Maldonado-Mahauad et al., 2018). However, the interview results show that interpretation of trace data is often ambiguous. More research of the kind presented here should be conducted to establish what components of trace data can be validly labelled, and how they should be labelled, and what components of trace data will remain ambiguous (Rovers et al., 2019; Van Laer & Elen, 2018). To achieve this aim of enhancing the validity of SRL measurement, further research could make use not only of trace data and interview data as presented in the current study, but could incorporate promising data collection methods such as eye-tracking (Salmeron, Gil, & Bråten, 2018; Trevors, Feyzi-Behnagh, Azevedo, & Bouchet, 2016).
Next to supporting the interpretation of the trace data, the interview data also provided empirical evidence that not all SRL activity is visible in the trace data. Such SRL activities are overlooked when trace data is used as the sole data source to measure SRL. The methodology presented here could be used to reliably establish which aspects of SRL can and which aspects of SRL cannot be measured with trace data. More research into learners’ SRL activities outside of the online learning environment will furthermore enable the development of a questionnaire to measure learners’ SRL activities that are not captured in the trace data. Hopefully, in the future, we can reliably and validly measure learners SRL with unambiguous interpretations of unobtrusively collected trace data from all learners, in combination with large scale measurement of learners’ SRL outside of the learning environment with a valid questionnaire.
Allen, I. E., & Seaman, J. (2014). Grade change: Tracking
Online Education in the United States.
Allen, I. E., & Seaman, J. (2016). Online report card:
Tracking online education in the United States .
Alshenqeeti, H. (2014). Interviewing as a Data Collection Method:
A Critical Review. English Linguistics Research, 3(1).
https://doi.org/10.5430/elr.v3n1p39
Azevedo, R., & Aleven, V. (2013). Metacognition and Learning
Technologies: An Overview of Current Interdisciplinary Research.
In R. Azevedo & V. Aleven (Eds.), International Handbook
of Metacognition and Learning Technologies (Vol. 28, pp.
1–16). New York, NY: Springer New York. Retrieved from
http://link.springer.com/10.1007/978-1-4419-5546-3_1
Azevedo, R., & Cromley, J. G. (2004). Does training on
self-regulated learning facilitate students’ learning with
hypermedia? Journal of Educational Psychology, 96,
523–535. https://doi.org/10.1037/0022- 0663.96.3.523
Barnard, L., Lan, W. Y., To, Y. M., Paton, V. O., & Lai, S.-L.
(2009). Measuring self-regulation in online and blended learning
environments. The Internet and Higher Education, 12(1),
1–6. https://doi.org/10.1016/j.iheduc.2008.10.005
Beishuizen, J., & Steffens, K. (2011). A conceptual framework
for research on self-regulated learning. In R. Carneiro, P.
Lefrere, K. Steffens, & J. Underwood (Eds.),
Self-Regulated Learning in Technology Enhanced Learning
Environments (pp. 3–19). Rotterdam, The Netherlands:
Sense Publishers.
Ben-Eliyahu, A., & Linnenbrink-Garcia, L. (2015). Integrating
the regulation of affect, behaviour, and cognition into
self-regulated learning paradigms among secondary and
post-secondary students. Metacognition and Learning, 10,
15–42. https://doi.org/10.1007/s11409-014-9129-8
Broadbent, J. (2017). Comparing online and blended learner’s
self-regulated learning strategies and academic performance. The
Internet and Higher Education, 33, 24–32.
https://doi.org/10.1016/j.iheduc.2017.01.004
Cicchinelli, A., Veas, E., Pardo, A., Pammer-Schindler, V., Fessl,
A., Barreiros, C., & Lindstädt, S. (2018). Finding traces of
self-regulated learning in activity streams (pp. 191–200). ACM
Press. https://doi.org/10.1145/3170358.3170381
Creswell, J. W. (2008). Mixed method designs. In Educational
research: Planning, conducting, and evaluating quantitative and
qualitative research (pp. 551–595). New Jersey, NJ:
Pearson Education International.
DiCicco-Bloom, B., & Crabtree, B. F. (2006). The qualitative
research interview. Medical Education, 40(4),
314–321. https://doi.org/10.1111/j.1365-2929.2006.02418.x
Ericsson, K. A., & Simon, H. A. (1993). Protocol analysis.
Cambridge, MA: MIT press.
Fincham, O. E., Gasevic, D. V., Jovanovic, J. M., & Pardo, A.
(2018). From Study Tactics to Learning Strategies: An Analytical
Method for Extracting Interpretable Representations. IEEE
Transactions on Learning Technologies, 1–1.
https://doi.org/10.1109/TLT.2018.2823317
Hadwin, A. F., Nesbit, J. C., Jamieson-Noel, D., Code, J., &
Winne, P. H. (2007). Examining trace data to explore
self-regulated learning. Metacognition and Learning, 2,
107–124. https://doi.org/10.1007/s11409-007-9016-7
Hew, K. F., & Cheung, W. S. (2014). Students’ and instructors’
use of massive open online courses (MOOCs): Motivations and
challenges. Educational Research Review, 12,
45–58. https://doi.org/10.1016/j.edurev.2014.05.001
Howard-Rose, D., & Winne, P. H. (1993). Measuring component
and sets of cognitive processes in self- regulated learning. Journal
of Educational Psychology, 85(4), 591–604.
https://doi.org/10.1037/0022-0663.85.4.591
Jansen, R. S., van Leeuwen, A., Janssen, J., Kester, L., &
Kalz, M. (2017). Validation of the self-regulated online learning
questionnaire. Journal of Computing in Higher Education,
29, 6–27. https://doi.org/10.1007/s12528-016-9125-x
Johnson, R. B., & Onwuegbuzie, A. J. (2004). Mixed Methods
Research: A Research Paradigm Whose Time Has Come. Educational
Researcher, 33(7), 14–26.
https://doi.org/10.3102/0013189X033007014
Jovanović, J., Gašević, D., Dawson, S., Pardo, A., & Mirriahi,
N. (2017). Learning analytics to unveil learning strategies in a
flipped classroom. The Internet and Higher Education, 33,
74–85. https://doi.org/10.1016/j.iheduc.2017.02.001
Karabenick, S. A., & Zusho, A. (2015). Examining approaches to
research on self-regulated learning: conceptual and methodological
considerations. Metacognition and Learning, 10(1),
151–163. https://doi.org/10.1007/s11409-015-9137-3
Kizilcec, R. F., Pérez-Sanagustín, M., & Maldonado, J. J.
(2017). Self-regulated learning strategies predict learner
behaviour and goal attainment in Massive Open Online Courses. Computers
& Education, 104, 18–33.
https://doi.org/10.1016/j.compedu.2016.10.001
Littlejohn, A., Hood, N., Milligan, C., & Mustain, P. (2016).
Learning in MOOCs: Motivations and self- regulated learning in
MOOCs. The Internet and Higher Education, 29,
40–48. https://doi.org/10.1016/j.iheduc.2015.12.003
Maldonado-Mahauad, J., Pérez-Sanagustín, M., Kizilcec, R. F.,
Morales, N., & Munoz-Gama, J. (2018). Mining theory-based
patterns from big data: Identifying self-regulated learning
strategies in Massive Open Online Courses. Computers in Human
Behaviour, 80, 179–196.
https://doi.org/10.1016/j.chb.2017.11.011
McGrath, J. E., Martin, J., & Kulka, R. A. (1981). Some
Quasi-Rules for Making Judgment Calls in Research. American
Behavioural Scientist, 25(2), 211–224.
https://doi.org/10.1177/000276428102500206
McIntosh, M. J., & Morse, J. M. (2015). Situating and
Constructing Diversity in Semi-Structured Interviews. Global
Qualitative Nursing Research, 2, 233339361559767.
https://doi.org/10.1177/2333393615597674
Min, L., & Jingyan, L. (2017). Assessing the effectiveness of
self-regulated learning in MOOCs using macro-level behavioural
sequence data. In Proceedings of EMOOCs 2017 (pp. 1–9).
Madrid, Spain.
Morse, J. M. (2010). Sampling in grounded theory. In A. Bryant
& K. Charmaz (Eds.), The SAGE handbook of grounded theory
(pp. 229–244). SAGE publications.
Nelson, T. O., & Narens, L. (1990). Metamemory: A theoretical
framework and new findings. In Psychology of Learning and
Motivation (Vol. 26, pp. 125–173). Academic Press.
Panadero, E. (2017). A Review of Self-regulated Learning: Six
Models and Four Directions for Research. Frontiers in
Psychology, 8.
https://doi.org/10.3389/fpsyg.2017.00422
Phillips, R., Maor, D., Cumming-Potvin, W., Roberts, P.,
Herrington, J., Preston, G., … Perry, L. (2011). Learning
analytics and study behaviour: A pilot study. Presented at the
Australasian Society for Computers in Learning in Tertiary
Education, Hobart, Tasmania, Australia.
Puustinen, M., & Pulkkinen, L. (2001). Models of
self-regulated learning: A review. Scandinavian Journal of
Educational Research, 45, 269–286.
https://doi.org/10.1080/00313830120074206
Reimann, P., Markauskaite, L., & Bannert, M. (2014).
e-Research and learning theory: What do sequence and process
mining methods contribute?: e-Research and learning theory. British
Journal of Educational Technology, 45(3),
528–540. https://doi.org/10.1111/bjet.12146
Robinson, O. C. (2014). Sampling in Interview-Based Qualitative
Research: A Theoretical and Practical Guide. Qualitative
Research in Psychology, 11(1), 25–41.
https://doi.org/10.1080/14780887.2013.801543
Rovers, S. F. E., Clarebout, G., Savelberg, H. H. C. M., de Bruin,
A. B. H., & van Merriënboer, J. J. G. (2019). Granularity
matters: comparing different ways of measuring self-regulated
learning. Metacognition and Learning.
https://doi.org/10.1007/s11409-019-09188-6
Russo, J. E., Johnson, E. J., & Stephens, D. L. (1989). The
validity of verbal protocols. Memory & Cognition, 17(6),
759–769. https://doi.org/10.3758/BF03202637
Salmeron, L., Gil, L., & Bråten, I. (2018). Using eye-tracking
to assess sourcing during multiple document
reading: A critical analysis. Frontline Learning Research, 6(3),
105-122. https://doi.org/10.14786/flr.v6i3.368
Schraw, G. (2010). Measuring Self-Regulation in Computer-Based
Learning Environments. Educational Psychologist, 45(4),
258–266. https://doi.org/10.1080/00461520.2010.515936
Strauss, A., & Corbin, J. (1994). Grounded theory methodology:
an overview. In N. K. Denzin & Y. S. Lincoln (Eds.) (Vol. 17,
pp. 273–285). Thousand Oaks, CA, US: SAGE publications.
Trevors, G., Feyzi-Behnagh, R., Azevedo, R., & Bouchet, F.
(2016). Self-regulated learning processes vary
as a function of epistemic beliefs and contexts: Mixed method
evidence from eye tracking and
concurrent and retrospective reports. Learning and
Instruction, 42 , 31-46.
https://doi.org/10.1016/j.learninstruc.2015.11.003
van Gog, T., Paas, F., van Merriënboer, J. J. G., & Witte, P.
(2005). Uncovering the Problem-Solving Process: Cued Retrospective
Reporting Versus Concurrent and Retrospective Reporting. Journal
of Experimental Psychology: Applied, 11(4),
237–244. https://doi.org/10.1037/1076-898X.11.4.237
Van Laer, S., & Elen, J. (2018). Towards a methodological
framework for sequence analysis in the field of self-regulated
learning. Frontline Learning Research, 6(3),
228–249.
Veletsianos, G., Reich, J., & Pasquini, L. A. (2016). The Life
Between Big Data Log Events: Learners Strategies to Overcome
Challenges in MOOCs. AERA Open, 2(3).
https://doi.org/10.1177/2332858416657002
Wang, C.-H., Shannon, D. M., & Ross, M. E. (2013). Students’
characteristics, self-regulated learning, technology
self-efficacy, and course outcomes in online learning. Distance
Education, 34, 302–323.
https://doi.org/10.1080/01587919.2013.835779
Winne, P. H. (2010). Improving Measurements of Self-Regulated
Learning. Educational Psychologist, 45(4),
267–276. https://doi.org/10.1080/00461520.2010.517150
Winne, P. H. (2014). Issues in researching self-regulated learning
as patterns of events. Metacognition and Learning, 9(2),
229–237. https://doi.org/10.1007/s11409-014-9113-3
Winne, P. H., & Jamieson-Noel, D. (2002). Exploring students’
calibration of self reports about study tactics and achievement. Contemporary
Educational Psychology, 27(4), 551–572.
https://doi.org/10.1016/S0361-476X(02)00006-1
Zimmerman, B. J. (1986). Becoming a self-regulated learner: Which
are the key subprocesses? Contemporary Educational Psychology,
11 (4), 307–313. https://doi.org/10.1016/0361-
476X(86)90027-5
5-10 min - Start-up
Introduction / welcome. Explanation of the interview goals. We will be talking about your learning experience when studying for the course XXX. We will be talking about how you organized your learning, the way you studied, the barriers you encountered, and potential solutions or improvements.
The interview will take approximately 45 minutes to one hour. The interview is video recorded. The recordings will be treated confidentially.
General outline. We will first talk about your motivations for taking the course, then we will look at your studying behavior in the online course environment. We will continue with discussing the overall learning process. We will then wrap-up by discussion solutions and improvements.

15 – 20 min - Micro process
Activities you as a user engage in on edX while you are learning in the course are stored on the server. For instance, when you click to play a video, when you pause a video, or when you answer a recap or test question. With this data, a flow chart can be created of a learner’s online behavior. << Show flow chart of another learner in another course >> Transitions from one activity to another are drawn to display the steps the learner went through while learning. << Show blanc flow chart of the course the learner took; thus without transitions >> This is the outline of the course you took. Explanation of the elements. It is understandable if you do not remember everything in detail. Please answer the questions to the best of your ability, but also feel free to indicate that you don’t remember.

<< Present the flow chart with the learner’s transitions
indicated >> This is the flow chart showing the way you
worked with the course materials. Explanation of the general
pattern of activities visible in the flow chart.

20 min - Macro process
After discussing your learning process in the online course environment, I would now like to talk to you about your learning for the course in general.

10 min - Improvement suggestions

Finally, I want to present you with some suggestions to improve
SPOC learning. I would like to hear your thoughts about them.
Pop-up when you log in asking you what your plans are.
Email once or twice a week with study advice and/or motivational
message.
Videos in the course with study tips; especially for SRL.
Assignments based on how to study (or recap questions about SRL).
5 min - Wrap-up / debriefing

Explanation of the interview purpose in case the interviewee is
interested in that information.
Explanation of the results that can be provided.
Allow the interviewee the opportunity to check the interview
transcript.