![]()
Frontline Learning Research Vol.8 No. 3 Special
Issue (2020) 63 - 84
ISSN 2295-3159
aUniversity of Leipzig, Germany
bUniversity of Eastern Finland, Joensuu, Finland
cUniversity of Jena, Germany
Article received 25 June/ revised 19 October / accepted 21 October / available online 30 March
This article proposes a study design developed to disentangle the objective characteristics of a learning situation from individuals’ subjective perceptions of that situation. The term objective characteristics refers to the agreement across students, whereas subjective perceptions refers to inter-individual heterogeneity. We describe a novel strategy for assessing and disentangling objective situation characteristics and subjective perceptions thereof, propose methods for analysing the resulting data, and illustrate the procedure with an example of a first study using this design to examine situational interest in 155 university students. Situational interest was assessed nine times per weekly lecture with three measurement time points per person and a rotated multi-group schedule. Assessments took place over the course of an entire semester of ten weeks. One of the advantages of the proposed design is that objective group agreements can be disentangled from subjective deviations from the group’s average at each of the nine measurement time points per weekly lecture. Furthermore, the proposed design makes it possible to study the development of both subjective and objective parameters across the time span of one weekly lecture and an entire semester, while the burden for each person is kept relatively low with three beeps per lecture.
Keywords: subjective self-reports, inter-rater agreement, experience sampling method, momentary motivation.
Imagine you attend a lecture that you love but that all your classmates seem to hate, dread, or find boring. You just love this lecture of Statistics and Research Methods, because of its exciting implications for epistemology and its answers to the question where knowledge comes from and how much we can(not) trust in what we know. You think this is one of the best, most interesting courses you have ever had, but your fellow students just don’t seem to share your enthusiasm for the philosophy of science or mathematical representation of knowledge. While you express your love for this Statistics and Methods course, nearly everyone else would rather study “real Psychology” or sleep in instead of starting the day with the 8:00 a.m. Statistics course. One of your classmates even called you a nerd. While you try to convince everyone that this course is objectively interesting, the other students try to convince you that this is an objectively uninteresting lecture, claiming that “if we all agree it’s boring, it can’t be objectively interesting”. Your best friend agrees with the others on that, but, trying to put himself in your shoes, also acknowledges that you have subjective reasons to find that lecture interesting, while also trying to convey to you that your subjective interest just isn’t everyone’s cup of tea. You discuss to what extent the agreement, or average interest, of the class reflects the objective interestingness of that course.
The Dean, in turn, holds the teaching evaluation in hand when announcing the decision to discontinue your favourite course in the future, citing the average lack of interest of the attendants as evidence for the objective lack of teaching quality, because all other Psychology courses got higher student ratings in the questions asking about students’ enthusiasm. You feel unheard and unseen, after all, aren’t you a data point in that statistic the Dean holds in hand, too? Didn’t your favourite Statistics teacher just yesterday teach you about the problem that sometimes individual students or subgroups hide behind the overall trend, so that we need methods to detect and describe these subgroups and deviating individuals?
This article presents a novel approach to disentangle and describe both the overall trend in the agreement of a class on the ratings of a learning situation, and the deviations of individual, subjective, perceptions from that overall trend. The methods proposed in this article promise to be insightful for a broad audience, including researchers using the experience sampling method for classroom assessments, educational technology developers looking for methods to provide metrics and visuals concerning student heterogeneity and objective situation characteristics in teacher dashboards and class feedback systems, as well as educators who are interested in situational measures of students’ classroom perceptions, momentary assessments supporting personalised learning, or teacher feedback for social-emotional learning. While we use the example of interest ratings throughout the article, the methods proposed here could also be applied to assess other learning-related classroom perceptions, such as students’ observations of teacher behaviour, or students’ perceptions of the current task being difficult or easy, to name a few. By disentangling the idiosyncratic and commonly shared components of motivational self-reports, this article makes a contribution to this special issue’s first question (“In what ways do self-report instruments reflect the conceptualizations of the constructs suggested in theory related to motivation or strategy use?“). We also address the second question of this special issue by proposing analytics strategies, but rather than focusing on the constraints mentioned in the special issue editorial, we focus on novel avenues for analyses.
Situational self-report assessments of motivation and emotion are more and more frequently used, thanks to new technology that makes it easier and cheaper than ever to ask participants in real-time via mobile devices about their current activities, as well as their subjective perceptions, feelings, and motivations, pertaining to these currently ongoing activities. The methods used to gather such data are called Experience Sampling Method (ESM; e.g., Hektner et al., 2007), ambulatory assessments (e.g., Fahrenberg, 1996), or ecologically momentary assessments (Shiffman et all., 2008). In this article, we use the term ESM.
Compared to the classic retrospective one-time administered self-report questions for motivation and emotions, ESM assessments have several advantages: A first advantage is that ESM assessments can capture the fluctuating and situation-specific components of motivation and emotions, while common retrospective, one-time administered self-reports do not reveal which aspects of the assessed variables fluctuate or remain stable from one situation to another. It is even possible to disentangle situational determinants (e.g., the exciting learning video used in today’s lecture) from stable personal factors (e.g., this student’s well-developed personal interest in the topic taught today or this students’ general openness to experience), or contextual factors (e.g., the generally monotonous teaching style of this teacher, or the loud noise in that classroom from the construction side next door, which has hampered the students’ attention and motivation for a year now). To disentangle such situational, personal, and contextual influences, ESM assessments can be combined with multilevel data analysis that decomposes the variance on the situational (within) level from the variance due to stable inter-individual differences (between level 1) and the variance between in contexts, such as class or school (between level 2; see e.g., Dietrich et al., 2017; Ketonen et al., 2018).
A second advantage is that situational measures have been discussed to be more valid than the retrospective self-reports, because in-the-moment assessments can reduce memory errors (e.g., Green et al., 2006; Takarangi et al., 2006) and response biases linked to beliefs and stereotypes that are otherwise activated in certain retrospective self-reports (e.g., Bieg et al., 2015; Goetz et al., 2013). While retrospective measures require participants to mentally aggregate their typical experience across all the situations they can remember, ESM data enable the researcher to empirically calculate such an aggregated typical experience as the mean score of the many repeated situational assessments for each person.
These advantages of ESM measures notwithstanding, they are still self-reports and therefore share many of the shortcomings related to self-reports with the retrospective measures. One of these shortcomings is the problem that ESM and other self-report measures capture only the subjective perception and rating of an experience, which do not necessarily reflect how other students would perceive the same situation. For example, if a student indicates a current interest of “4 – very much” on a four-point scale, the reasons for that choice of this response option remain unclear. Did this student choose this rating because he/she had a personal interest in this topic, while most other students were utterly bored? Or because this was the most captivating topic ever taught, and every student in the class was captivated and would agree? Or did the student just affirm being interested because of a very high individual level of trying to appear socially desirable? In classic ESM studies, it is very difficult to disentangle these different options, because typically, students are asked about activities at random times, implying that every student has an own individual random survey schedule, so that there is usually no way to determine how other students perceived the exact same situation.
To provide a solution for that problem, this study presents a research design that enables researchers to systematically assess groups of students at the same time points, so that inter-individual agreements and subjective deviations from these agreements can be distinguished.
The previous literature provides some examples of theories that distinguish between the subjective and objective components of information provided by self-reports in education (e.g., Göllner Wagner et al., 2018; Lüdtke et al., 2009). One such example is the research on interest, particularly the person-object theory of interest (Fink, 1991; Krapp, 2002; Krapp & Fink, 1992; Prenzel et al., 1986), which distinguishes between objective characteristics of a learning situation and the individual’s subjective perceptions thereof, as well as distinguishing between fluctuating situational and stable personal determinants of the subjective perceptions. As the name person-object theory suggests, interest is expected to result from two main conditional factors, person characteristics and situation characteristics (Krapp, 1998). According to this theory, interest emerges in the interaction of a person with particular objects (including concrete objects, such as texts, and more abstract ideas, events, topics, texts, etc.). Objects are expected to differ in their likelihood of eliciting situational interest in individuals, depending on their verifiable, observable features. For instance, learning materials are more likely to trigger situational interest if their objective features make them surprising, novel, visually stimulating, and intense for the students. Texts are likely to trigger situational interest if they are, for instance, easy to comprehend, cohesive, vivid, if they evoke emotional reactions, and allow for collaborations with others (for overviews, see e.g., Krapp et al., 1992).
The (objective) interestingness of a situation is then perceived by individuals who differ in their stable, dispositional personal interests (Krapp et al., 1992) and their perceptions of the situation (e.g., a given information about the theory of relativity might be new to most students in a class, except for Max, who has heard about the topic extensively over dinner from his mother, who is a Quantum Physics professor). The individuals then feel more or less interested in the current learning situation, depending on their previous dispositional interest in the currently discussed topic (person characteristic) and the learning situations’ objective characteristics. Thus, a fluctuating psychological state of more or less situational interest can be observed, which is either an expression of the currently actualised dispositional interest, or the fluctuating reaction to the objectively interesting situation, or a mixture of both (e.g., Krapp, 1998). The distinction between objective situation characteristics, student’s subjective perceptions of these objective situation characteristics, and objective person characteristics is depicted in Figure 1, based on the person-object theory of interest visualized in Krapp (1998).
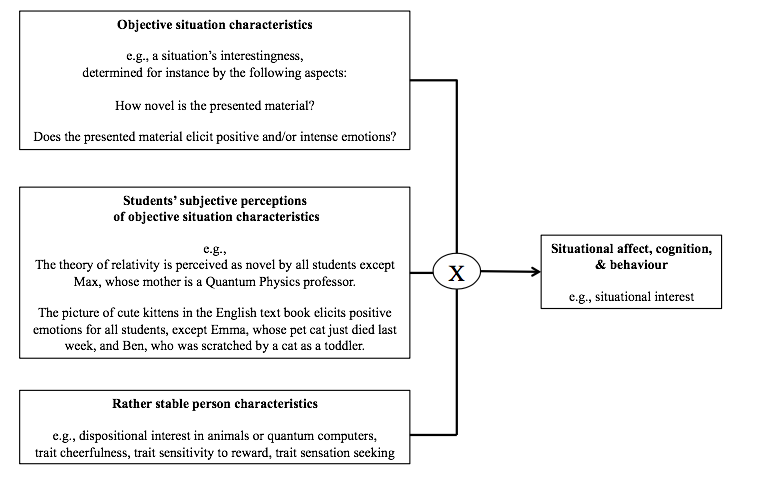
Figure 1. A model of the person-object theory of interest based on Krapp, (1998). We added the distinction between objective situation characteristics and subjective perceptions thereof.
We expect that such models of person-object interactions will be fruitful not only for the understanding of interest, but also for the understanding of other motivational constructs, cognitions, and behaviours. For example, a student’s overall perception of a teacher’s behaviour in a given learning situation may be influenced by objective situation characteristics (e.g., the teacher’s in-fact behaviour), and by the student’s subjective perceptions of the teacher’s objective behaviour, and by stable or fluctuating student characteristics (e.g., the student’s subjective liking of that teacher or the student’s dispositional interest in the subject). Likewise, a student’s learning in a given learning situation may be influenced by objective situation characteristics (e.g., the difficulty of the task, compared to tasks previously presented to the same student), by the student’s subjective perceptions of those objective situation characteristics (e.g., the student’s subjective appraisals, self-efficacy), as well as by stable person characteristics (e.g., the student’s intelligence, ability self-concept, perseverance in the face of obstacles). These are just a few of the possible applications of the person-object-logic presented in Figure 1, suggesting that this model might be a useful framework for understanding and assessing learning processes in classrooms.
Please note that we use the term “stable” in the following to refer to aspects that do not change across measurement time points for the duration of an experience sampling method study (typically a few days), meaning aspects that are modelled in multilevel models on the person-level as stable inter-individual difference components. By using the term “stable” in that sense, we do not mean to imply that those empirically stable components cannot develop over longer periods of time, and we do not mean to rule out that personality development takes place. We merely imply that such eventual long-term development is usually not captured or distinguishable by the short-term longitudinal data that we discuss in this article.
This article has three main goals: First, we introduce a novel design for ESM studies that enables researchers to disentangle the objective characteristics of a situation (e.g., the situation’s interestingness, in terms of the inter-subjective agreement of all students) from each person’s subjective perception of that situation (e.g., the subjective interest and deviation from the aforementioned inter-subjective agreement). Second, we propose different analytical strategies to analyse data assessed with this novel design and illustrate some of these proposed analyses using data from a first study that has used this novel assessment design to assess situational motivation in 155 university students. Third, we discuss a number of possible additional strategies of contrasting the situational self-reports of ESM assessments with more objective data, such as behavioural classroom observations or psychophysiological measures of emotion-related data.
This is a theoretical article with the main goal to propose a new assessment design, and to discuss its advantages as well as limitations. Therefore, our research questions refer to theoretical and methodological rationales, while the empirical results presented in this article merely serve as illustration and example for the methodological discussion, rather than being a centrepiece. Thus, the topic examined in the empirical part (students’ situational interest in higher education) is treated as a rather exchangeable example of a construct, which to examine the here proposed method could help.
RQ1: What concepts of objectivity can be applied to disentangle
objective characteristics of situations from participants’
subjective perceptions thereof?
RQ2: How do ESM research designs and schedules have to look like
in order to capture both the objective situation characteristics
and the subjective perceptions thereof?
RQ3: What analyses are needed to disentangle the objective
situation characteristics and the subjective perceptions thereof
in data collected with a design proposed under RQ2?
The research questions are mostly answered theoretically, but with references to an empirical study that will serve as an illustrating example for the proposed methods. This example study is described in the following.
The participants were 155 German university students (51% female; mean age M = 21.77 years, SD = 2.91; range: 19 to 46 years). The participants studied in a teacher education program with the aim to become subject teachers for secondary schools. Students provided intensive longitudinal data in the form of ESM surveys and were followed over one semester in a weekly lecture with 90-minute lessons (except for lesson 4, which ended after 60 minutes ahead of schedule). The subject of the course was ‘Psychological fundamentals of learning’. In each of ten consecutive weeks, students received notifications and questionnaires at fixed schedules, three times during each lesson, consisting of ten situational motivation items. The participants chose whether to respond online with their own smartphone or on paper-and-pencil questionnaires (smartphone: 58–71% participants with a mean of 65% across the ten lessons; paper-and-pencil: 29–42% participants with a mean of 35%).
N = 155 students provided valid information on situational measures in at least one lesson. During the data cleaning, we removed responses in the following cases: if the response was given more than 15 minutes after the signal (applies to the time-stamped online responses, not the paper-and-pencil response); if a person reported being present at the lecture but responded online after the lecture had ended; if a person responded to the three surveys immediately after another; and if a person responded with the same value on all ten items. This resulted in the omission of 251 surveys. A total of 2,226 completed ESM surveys remained in the analysis sample, which equals 48.94% of the possible full data (three responses per lesson by ten lessons, except for week four, which ended early and therefore included two responses per person only) by 155 participants resulting in 4,495 responses). 2200 of those completed ESM surveys had valid responses on at least one of the interest variables used in the analysis for this article and thus appear as the sample size in our Mplus output (Moeller et al., 2019). Although paper-and-pencil surveys were not time-stamped, they were handed out before and collected after each lecture, so that responses on paper-and-pencil forms were only possible during the lecture.
The theoretical framework for the data collection originally was Eccles’ expectancy-value theory (Eccles et al., 1983), according to which expectancies and values of a task are central motivational forces in students’ academic behaviours and learning (Eccles & Wigfield, 2002). They predict academic choices, persistence, and achievement (e.g., Battle & Wigfield, 2003; Cole et al., 2008; Durik et al., 2006). The dataset was also used in previous studies (Dietrich et al., 2017; Dietrich et al., 2019). These previous studies examined associations of situational expectancies and task values with effort (Dietrich et al., 2017), and situational expectancy-value profiles (Dietrich et al., 2019). None of these previous papers analysed the cross-classified data structure in this dataset.
All data and R and Mplus syntaxes for the calculations presented in this article are openly accessible at the Open Science Framework (Moeller et al., 2019).
The ESM assessment captured situational task values and expectancies with eight items (see Dietrich et al., 2017 or https://osf.io/qjkmz/). Additionally, situational interest and situational effort were assessed with one item each. The students were instructed to think about the lecture contents of the past couple of minutes and to complete the questionnaire within nine minutes. They were asked “To what extent do the following statements apply to you in the present moment?” and responded on a 4-point Likert scale ranging from 1 = does not apply to 4 = fully applies.
In the present article, we constructed an averaged composite score, labelled situational interest from two items measuring situational interest (“I am interested in these contents”) and situational intrinsic value (“I like these contents”). While most ESM studies assess constructs with single items to keep the burden on the participants as low as possible, we opted to assess each construct with multiple items (see Dietrich et al., 2017 or https://osf.io/qjkmz/), based on the idea that the shared variance of multiple indicators is a more reliable indicator of an underlying construct than a single item can be. It could be argued that this approach of using composite scores instead of single items in itself is a contribution to making ESM assessments more objective, as it reduces the risk of confounding a construct of interest with the random and unique influences (unique variance) that a single item captures apart from the construct it is supposed to represent (e.g., a momentary slip in attention causing the respondent to click on a wrong response option, or an idiosyncratic misunderstanding by a given participant of a given item in a given situation). In a cross-classified multilevel model with responses (within level, n = 2,200) nested in both individuals (between-individual level, n = 155) and time points (between-time point level, n = 87), the correlations between the two items of the situational interest scale were r = .62 at the within level, r = .93 at the between-individual level, and r = .99 at the between-time point level.
When using the term objectivity, we assume that there are true characteristics of an object (in this study, a learning situation) that influence individuals’ subjective responses in a somewhat systematic way that causes at least partial agreements in the subjective responses of multiple individuals. Skipping the important and millennia-long philosophical discussions about whether or not there is a truth and how to define and understand it (for a summary, see e.g., Glanzberg, 2018), we pragmatically define objectivity here as the (approximate) agreement of all observers about the characteristics of an object, with the object here meaning the learning situation. This here applied concept of objectivity is based on Popper’s claim that “the objectivity of scientific statements lies in the fact that they can be inter-subjectively tested” (1934 [2002], p. 22). While Popper refers to scientific statements rather than laymen’s implicit concepts, his idea of objectivity as inter-subjective agreement has been extended: Douglas (2011) has named this concept of objectivity the concordant objectivity and defines it as the “simple agreement among multiple observers” (Douglas, 2011, p. 32). This idea of objectivity as the inter-subjective agreement about the truth of an object is reflected in the classical test theory, which typically considers assessments to be objective to the degree that all trained assessors come to the same conclusion about an assessed construct in a given individual or population. It is also reflected in the practice of treating a classes’ mean score of averaged individual student responses about perceived teaching quality as a proxy for the objective teaching quality in that classroom (see e.g., Göllner, 2018; Lüdtke et al., 2009). It is important to keep in mind that this is a rather parsimonious concept of objectivity and that many more have been discussed in the social sciences, including Education (e.g., Eisner, 1992; Fisher, 2000).
How can self-reports ever be objective in the sense of concordant objectivity, given that the construct to be assessed (e.g., an emotion) is typically experienced only by the individual who experiences it, which also is the reason why we ask participants to report us their feelings in self-reports? While it is controversially discussed to what degree it is possible to objectively determine how exactly a person feels without relying on this person’s subjective self-report (e.g., Barrett, 2018), it is arguably possible and useful to assess the characteristics of a situation that are related to the emotional experiences. For example, since previous research on situational interest suggests that it is largely triggered by objective situation characteristics, such as novel and surprising information being presented, we can expect that multiple individuals agree partially in their situational interest in one learning situation, as long as the information presented to them is equally novel and surprising to each of these individuals.
One possibility of deriving information about objective characteristics of a situation from subjective self-reports is to aggregate the multiple self-reports of different individuals about the same situation. In that sense, the objective assessment of, e.g., a situation’s interestingness, would be the agreement of a large enough number of randomly selected individuals about the interest they felt in that situation. In this scenario, we would expect that the group of students tends to report higher situational interest in learning situations presenting students with novel and surprising stimuli, compared to learning situations presenting students with known, unsurprising stimuli, as long as the stimuli in both cases are otherwise similar. The group’s average (inter-subjective agreement) of reported interest in a given situation would thus be an indicator of the objective characteristics (interestingness) of that situation.
A limitation of the here-applied definition of objectivity is that the group’s mean score in a situation may be sample specific. If we select only the most interested individuals, then their mean interest in a given situation may be high, not because of the situation being novel and surprising, but because of the generally high interest of the group across all situations. Thus, the group mean score in a given situation may reflect the possible interactions between the group’s person characteristics and situation characteristics, rather than indicating the objective situation characteristics alone.
With the aforementioned definition of objective assessments of situational characteristics through inter-subjective agreements across individual subjective self-reports, we need momentary assessments from multiple individuals in the same situation to aggregate these multiple self-reports to a situation-specific group mean score.
What exactly the term same situation means depends on the research question of a given study. For instance, the objective interestingness of a learning situation can be assessed by asking all the students in the same class in the same instant about their current interest in that moment, and then aggregating across these individual responses. If, however, students learn remotely and self-paced with digital learning platforms, then a situation in terms of the research question could either be a certain time point (e.g., Tuesdays afternoon, or 24 hours before the final exam), or it could be the individual time point at which each student finishes a given task that is relevant to the research question, or another condition with relevance to the understanding of a digital learning moment. In this article, we use the term situation synonymously with a given time point in a given lecture hall in which all students see and hear the same university lecturer talking in the front of the room and are asked at the same time point about their momentary motivation, as described in Dietrich et al. (2017).
In order to assess multiple individuals in the same situation, we need to modify the common design of individually randomly timed survey notifications used in many ESM studies. For our purpose, we need to assess a large enough group of students at the same time, whereas the common ESM schedules typically assesses each student at their own individual random times in order to capture a true random sample of all the experiences that students make during a relevant unit of time, like a school day (e.g., Hektner et al., 2007). If we deviate from such truly random and individual schedules in order to examine students’ inter-subjective agreements in one given situation, then the so-collected data may not be a representative sample of everyday life activities.
However, there are many research questions that do not require a representative sample of all everyday life activities. For example, research questions referring to specific school subjects, or specific teachers, or specific lectures, require these contexts to be oversampled to ensure a large enough sample of situational assessments in that chosen context. One challenge in the use of not randomly timed ESM surveys is the risk of systematic context-specific biases in the assessments: The smaller the range of assessed time points or situations, the larger the likelihood of non-random influences. For example, in a truly randomly timed ESM study, we would not expect the results to be influenced by the time of the day, or the students’ distractedness during the last minutes of a class when everyone already packs their things to jump up at the first ring of the school bell, or other influences that are particular to a certain timing, because these influences are expected to cancel out. In contrast, if we decide to assess students only in the last five minutes in each class, for instance because teachers are concerned about interruptions and a no-phone policy during lessons, then we cannot rule out that the timing might have biased the responses in a way that a random survey schedule would not have. In order to reduce the risk of contextual biases in the assessments of multiple participants in the same instants, we need to make sure that at least there are no biases concerning the timing of surveys. That means that whatever the time span relevant to the study, no participants should be surveyed only at the beginning or only at the end of that time span. Instead, surveys should be distributed equally across these time spans for all participants.
For that purpose, we have developed an assessment design described below for the study of momentary study motivation in a university course across an entire semester (see also Figures 2 and 3). The weekly 90-minute lessons of that course are split into nine periods of nine minutes each (not ten minutes, because the participants need at least one minute to answer to the last survey in the lecture and would miss that last notification if it occurred when the end-of-lecture-noise and hectic has already started). To make sure that we have data detailing the motivation across the entire lecture, we assess participants after the first ten minutes, after 19 minutes, after 28 minutes, and so on. We start the first assessment after ten instead of nine minutes, because in the first few minutes, some time tends to get lost on welcoming and waiting for students to calm down. To keep the burden on each individual participant low, each participant is only surveyed three times during the lecture, with a time gap of 27 minutes between each assessment. To assess multiple participants at the same time while still pursuing the aforementioned goals (data across the entire lecture, no participant surveyed more than three times), participants are surveyed in groups, with group A being surveyed after the first 10 minutes, Group B being surveyed 19 minutes into the lecture, Group C being surveyed 28 minutes into the lecture, and then Group A again being surveyed 37 minutes into the lecture, and so on. The same design is then repeated one week later in the same lecture, but with the difference that Group B starts the assessments 10 minutes into the lecture, in order to rotate the survey times across all groups, times, and weeks (Figure 2). Individuals were randomly assigned to groups in a way that ensured a relatively equal sample size of each group.
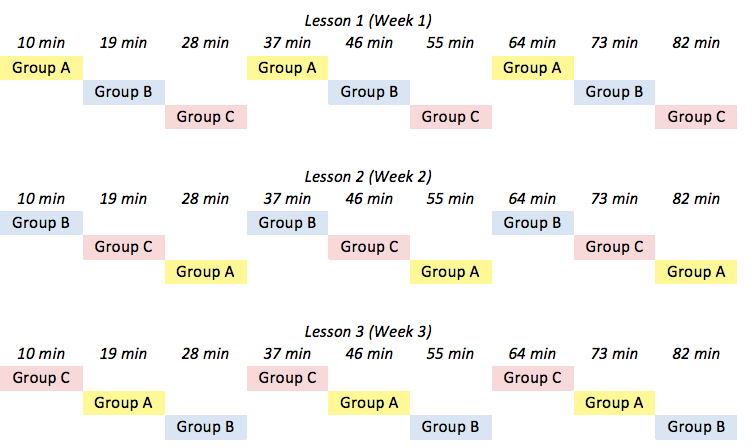
Figure 2. Example signalling schedule in lesson 1, 2, and 3 (to be rotated in following lessons)
3.3.1 Analytical strategy 1: Visualising the inter-personal agreement (objective parameter) and the subjective deviation from that agreement (subjective parameter): Jittered violin plots
To start the analyses of the data gathered with the assessment design proposed above, it is recommendable to get an overview of the distribution of the responses at each measurement time point. To explore how much participants agree or individually deviate from the average rating of the interestingness of a learning situation, we suggest examining the inter-individual distribution of interest ratings for every beep in a given lesson with a jittered violin plot (using the R package ggplot2 with the jitter option). Figure 3 shows an example of such a plot.
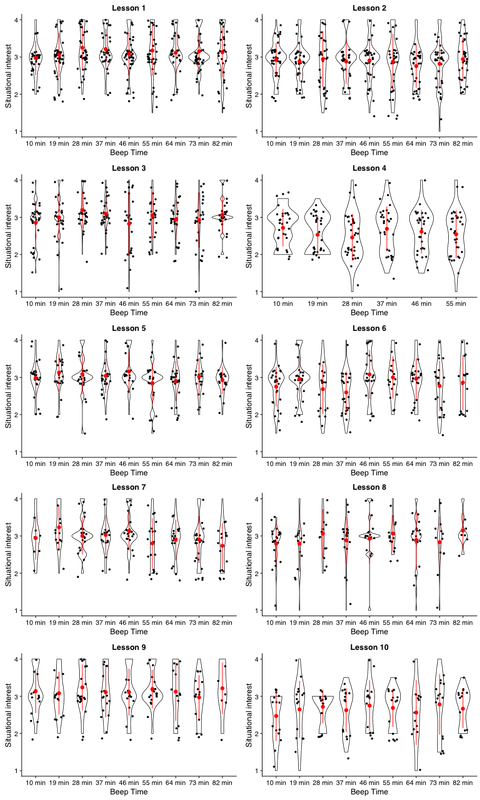
Figure 3. Inter-individual distributions of situational interest for each beep across the ten lessons, visualised in a jittered violin plot (note that lesson 4 ended after 60 minutes, which is why three violins are missing for the last three measurement time points)
The jittered violin plot shows the inter-individual mean score (red dot), the standard deviation (distance between the red dot and one end of the red line), and the inter-individual distribution of interest ratings (black dots) for each measurement time point / beep in each lesson. The belly of the violin is proportional to the number of individuals who agreed on a rating, with a thick belly meaning that many participants chose this value in their rating of their current interest. Since many observations (dots) would have overlapped on the interest values of 2, 3, and 4, we used the option to jitter the dots, which “adds a small amount of random variation on the location of each point” (Wickham et al., n.d.; Wickham, 2016) to prevent overlap and to display the number of the individual responses for each value.
The visual inspection of the violin plots indicates whether the assessed group of students tends to agree, as indicated by violin plots with one clearly distinguished belly (e.g., Figure 3, lesson 1, 10 minutes), or if the responses are randomly distributed across the possible range of values without any particular group agreement, indicated by a flat plot without any belly (e.g., Figure 3, lesson 3, 46 minutes), or if there are two or more distinct groups, each of which agree on their own particular score, indicated by a violin plot with multiple bellies (e.g., Figure 3, lesson 4, 55 minutes). The latter case of a mixed distribution can additionally be examined with statistical tests that tell whether the distribution is unimodal, bi- or multimodal, such as Hartigan's dip test statistic for unimodality versus multimodality (Hartigan & Hartigan, 1985). These tests can be performed with the R package diptest (Maechler, 2016) or the bootstrapping procedure determining the number of modes described in Efron & Tibshirani (1993), which uses the R package bootstrap (Tibshirani & Leisch, 2019). It should be noted that the concept of concordant objectivity applied in this article requires the existence of a unimodal distribution, meaning a high concentration of responses closely around the mean score. If the distribution is bi- or multimodal, then there is no reason to assume that the responses reflect one inter-subjective objectivity, and no reason to claim that the inter-individual mean score was an indicator of such concordant objectivity. Whether or not responses reflect inter-subjectively objectifiable information likely depends on the construct and needs to be determined with the above-mentioned strategies (number of bellies in violin plots and tests for uni- versus multimodality). As Figure 3 shows, the distribution and uni- versus multimodality can also differ from moment to moment, not only from construct to construct. Furthermore, Göllner et al. (2018) have also pointed out that the individual’s deviation from the group’s mean score does not have to be due to individual rater tendencies or biases, but may represent meaningful information about dyadic experiences. Using the example of teaching quality, the authors argue that different students can make different experiences with the same teacher, so that their deviation from the group mean score may reflect such observable differences in different dyadic experiences. This suggests that not only the group average can serve as an indicator of objective situation characteristics, it is furthermore possible that individual students make experiences that other students don’t make, but that other students still would rate the same way if they experienced the same.
3.3.2 Analytical strategy 2: Parameters for the deviation of a subjective rating from the objective group rating: Cross-classified multilevel analyses
After getting a visual impression of the degree of inter-rater
agreement on the interestingness of a situation, we might want to
calculate parameters quantifying the degree of inter-rater
agreement and the degree to which each person at each measurement
time point deviates from the group average. In particular, we want
to get estimates for (1) the individual and time point-specific
deviation from (2) the stable person-specific mean over time, and
from the (3) the inter-individual group mean which may differ from
situation to situation (i.e. from time point to time point). While
component three represents the objective situation characteristic
in terms of the characterization the participants can agree on
(the average rating of that situation), component one represents
the subjective situation-specific deviation from that objective
rating, i.e., the subjective element. We would like to control
both components 1 and 3 for component two, which represents the
stable individual deviation from both the objective situation
characteristic and the momentary subjective component due to
stable response tendencies of that person (e.g., traits). Such
variance decomposition can be done with a cross-classified
multilevel analysis (e.g., Beretvas, 2010). This type of
statistical model separates the total variance of the scores Yit
(the scores of the different individuals i at the different time
points t) in the three aforementioned components:
Yit = Y1i,t (component one, within time point and within
individual)
+ Y2i (component two, between individuals)
+ Y3t (component three, between time points)
The cross-classified multilevel model has the advantage that it allows disentangling the person- and situation-specific deviation (subjective state component) from the group average (objective state component), while accounting for each person’s stable tendency to deviate systematically from other individuals across all measurement time points (trait component).
Instead of the more common structure of ESM data, with situations nested only in individuals due to the randomness of the time points, the here proposed assessment design results in time points nested in both individuals (Y2i), and the groups A, B, and C with their respective measurement times (Y3t). Time points are crossed with individuals, because each individual appears only once within each measurement time point. To get reliable estimates about the variance components Y1i,t, Y2i, and Y3t, sufficiently big samples of individuals and time points are needed (around n = 50 on each of these levels; Chung et al., 2018). The present study design comprises of n = 155 individuals and n = 87 time points.
We computed the above-described model to separate the total variance [var(Yit) = .403] into the three variance components. The biggest portion of the variance pertained to the subjective deviation from both the situational group average and the stable person-specific trait component. This individual, situation-specific component one showed a variance of var(Y1i,t) = .250, which equals 62% of the total variance. Second, stable inter-individual differences (traits; component two) accounted for 31% of the variance: var(Y2i) = .124, which means that about one third (31%) of the variance is due to stable person-specific response tendencies that differ between individuals. Finally, the variance of the objective component three was considerably smaller: var(Y3t) = .029, 7% of the total variance. That means in other words that only a small amount of variance was due to changes in the situation-specific group mean score from one moment to another.
This study suggested a novel research design that allows to disentangle the objective characteristics of a situation from participants’ idiosyncratic momentary subjective deviations from those objective situation characteristics. For example, this novel approach allows disentangling the objective interestingness of a situation from a participant’s subjective interest in that moment.
The key of this assessment design is the simultaneous assessment of multiple participants in the same situation / time point, which enables researchers to examine to what degree individuals agree on their ratings of a given construct in that given situation, and to what degree individual participants deviate from that group agreement. We proposed several methods to analyse data assessed with this design and to further examine the role of objective versus subjective components, including jittered violin plots displaying the distribution, means and standard deviations of each measure for each measurement time point, and cross-classified multilevel analysis.
A ground-breaking advantage of the here proposed assessment design is the fact that it makes feedback to teachers about the objective situation characteristics possible. The group agreement indicating the objective interestingness of a situation for example enables teachers to compare their teaching topics and strategies in terms of how they make their class feel. In common momentary assessments in classes, students are typically asked at random time points, implying that for each assessed situation, there is typically only one answer for one individual student. Imagine you were a teacher wanting to know how your new teaching strategy came across to the students, and the researcher tells you: “See, at this time point, ten minutes into your lecture, you introduced the theory of evolution, and Mary reported high boredom and low interest”. Would you, as the teacher, conclude that the new teaching strategy failed to raise the students’ interests, or would you rather hypothesise about this one student’s idiosyncratic reasons for not being interested, or would you remain clueless as to how to interpret this feedback? With the approach of asking multiple students at the same time suggested in this article, it now becomes possible to tell teachers: “See, at this time point, ten minutes into your lecture, you introduced the theory of evolution, and the average interest reported by your students was high, even though a single student, Mary reported high boredom and low interest”. This feedback enables teachers to evaluate the average and the individual perception of their teaching strategies by their students, which we hope will become an important tool for immediate feedback in learning settings.
Imagine for instance that the feedback occurs in real time and the teacher learns that most students are interested but two students are utterly bored. In that case the teacher could offer optional challenging bonus tasks for the two students who might be underwhelmed by the regular classwork. If the entire class is bored, then the teacher could use activating, engaging teaching strategies by trying to cheer up the class with a joke, increasing the task difficulty for everyone, or adding real-life examples allowing students to see the links between the discussed topic and their own interests. As another option, teachers could use the feedback to analyse and revise their teaching strategies and materials after the course or school year has ended. In our studies, we combined the momentary assessments with videos of the lecture, showing both lecturer and slides, allowing us to link the teaching behaviour and materials to the students’ momentary motivation. These videos, which are yet to be analysed, are meant to help the teacher (and us researchers) understand which behaviours are most, or least, motivating, and which slides should be modified to foster future students’ motivation.
Obviously, collaborations between researchers, and/or software developers and teachers are needed to realise this possibility, unless the researcher and the teacher is the same person (as in the here presented study on motivation in university lectures). The here presented methodological groundwork needed is only the first step in that direction. A next step would require collaborations in which researchers use these methods to identify students’ individual needs as well as momentary classroom levels of motivation and emotions. Systematic collaborations of researchers and teachers are needed to provide teachers with the suitable emotion and motivation measures and assessments, and to provide researchers with the real-time data out of real school classrooms. Technology experts are needed for the further development of feasible feedback systems that show the collected data in comprehensible form and real time to students, teachers, and – in the case of underage students – parents. Science communication and more research are needed to find out which form of feedback about the assessed motivation and emotions would be most helpful to students, and teachers.
The combination of the approaches proposed in this article has much potential for the research on motivational heterogeneity of students. The intensive longitudinal data allow for the intra-individual examination of short-term developments (from one measurement time point in a given lesson to the next) and intra-individual long-term development of motivation or emotions (from lesson one to lesson ten). The jittered violin plots can be used to identify particular students as much as they can be used to detect overall trends, like an increase or decrease in the average inter-individual interest from one moment in the lecture to the next.
While common experience sampling method approaches provided no information about a students’ deviation from the simultaneously present peer group, the here proposed approach can be used to identify, within any given learning situation, those students who score substantially below the benchmark of interest typical for the simultaneously present peer group. This information potentially makes assessments of learning-related emotions and motivation at the same time more person-specific and more situation-specific. Instead of classifying students as generally less interested than their peers (which a classic ESM approach can do by examining the person-level mean score), our approach enables researchers or educators to say: “Although Mary has a tendency of being less interested than her peers in Math lessons, you really caught her interest with your most recent novel teaching strategy, which brought Mary’s interest even above the level of her peers, as you can see in the last two violin plots (where Mary can be marked as a yellow star among the black dots representing her peers)”. Thus, we expect that the approach proposed here will make a contribution to personalised learning (e.g., Corno, 2008) and tailored interventions for individual students at the exact times when they are in need of motivational and emotional support. Common experience sampling approaches seem less useful for these purposes, because they leave open whether a given measurement score reflects the individual’s subjective interest or the situations’ objective interestingness, or, if both, which of those components to what degree.
By offering techniques to disentangle the idiosyncratic and commonly shared components of motivational self-reports, this article contributed to this special issue’s first question (“In what ways do self-report instruments reflect the conceptualizations of the constructs suggested in theory related to motivation or strategy use?“) and second question (“How does the use of self-report constrain the analytical choices made with that self-report data?”). In sum, our answers to these questions are that self-reports only capture a person’s perception but can be aggregated to draw conclusions about the perceptions of a group of persons, their agreements and disagreements, about the characteristics of the (learning) situations they perceive. This article’s focus on self-reports of interest in learning settings complements several other articles in this special issue (Chauliac et al., & Donche; Fryer et al.; Durik & Jenkins).
One limitation of the design suggested in this article is the fact that the results inherit the problems linked to self-report data, including the fact that self-reports are always to a certain degree idiosyncratic, even when they are averaged or when group agreements are disentangled as a separate source of variance. This implies for example that the group mean score, which we described as the indicator of the objective situation characteristics (e.g., the objective interestingness of a situation) can be sample specific. Imagine if we selected only the most interested individuals for some reason, then their group mean score (objective component) in a given situation will be high, not because the situation is objectively highly interesting but because we only asked the highly interested individuals. Therefore, the objective component of the situational assessments is only objective to the degree to which it can be generalised from the observed sample to a larger population, which is a question for systematic replication studies to examine. If all or many participants in a sample are influenced by similar biases (for instance because we are surveying a group with particularly high social desirability), their agreement (the group average in a given situation) will reflect this joint bias rather than an objective situation characteristic. These are limitations to our definition of objectivity that need to be kept in mind.
Another limitation is the possible diversity of different activities that students who are present in one classroom might be engaged in. For example, in a class taught with a personalised learning approach, different students might be working on different tasks with different instructions. In some personalised learning settings, students in one classroom wear hearing protection to concentrate and receive their individual tasks on technological devices (e.g., tablets) contingent on their prior tasks completed, achievements, and goals. In such settings, it seems unreasonable to assume that the agreement of all raters on, e.g., their current interest, would reflect the objective interestingness of the learning moment, since it is likely that different students were thinking about different tasks when answering.
A third limitation is the requirement of large classes for the design proposed in this article. In order to interpret the distribution and degree of agreement of different raters at any given time point, a reasonably large group is needed. The design proposed in this article was developed for large university lectures, which often involve 200 students or more. Cross-classified models require least 50 students and 50 measurement time points in total (Chung et al., 2018). Per student, at least 10 measurement time points and per measurement time point 10 students responses are needed. However, 10 responses still seem too small of a sample from the standpoint of sampling theory and power considerations, for instance because of the biases that are more likely to affect small samples, compared to larger ones (e.g., Creswell & Guetterman, 2019; Schönbrodt & Perugini, 2013). The purpose and planned analysis should drive the sample size planning, because different approaches require different sample sizes.
In most school classes, it might be less useful to split the class into three groups of responders with different ESM signalling schedules, since many school classes comprise less than 30 students, implying that with the design proposed here, each subgroup at any given time would include no more than ten responses, likely less if school absences, smaller class size, and unwillingness to respond to ESM signals are taken into account. A possible solution in reasonably large classes might be to signal all students at the same times (e.g., after 25, 50, and 75 minutes of a 90-minute lecture). As a rule of thumb, we recommend to assess all students at the same time if less than 30 students are present, to avoid biases of the group mean score due to outliers. This reduces the number of measurement time points and consequently offers less insight over short-time changes in students’ experiences over the course of a lesson, while keeping the burden on each individual student the same (three signals per lesson). If this suggestion is implemented and all students in a school class are surveyed at the same time, then we suggest that the teacher could interrupt the lesson for the duration of the survey to allow students to concentrate on the survey and to avoid that students miss any relevant learning information. To further avoid sample biases, particularly in smaller samples, it might be worthwhile considering to assign matched participants to different groups, so that individuals with similar person characteristics can be found in and compared across all groups. However, it seems unlikely that the needed variety and combinations of person characteristics needed for such matching procedures can be found in small samples such as school classes.
It is furthermore not possible to rule out that nonresponse to ESM signals might be confounded with the constructs being assessed. For example, the most motivated, immersed students might prefer to continue working on their captivating math task and might even miss the ESM signal due to their intense concentration. In some personalised learning classrooms, the headsets that students wear to avoid distractions by their classmates make it difficult to raise their attention to ESM signals, unless these signals come through the same devices their headsets are attached to, which is not always possible. On the other hand, particularly bored and disengaged students might see no point in responding to the ESM surveys. These scenarios of data not missing at random imply that the empirically observed agreement of different students does not necessarily reflect the agreement of all students or the objective situation characteristics, but could itself reflect a biased subsample.
It seems possible that constructs and situation characteristics differ in their potential of being perceived in the same way by different students. It might be easier for students to agree on a question referring to the interestingness of a situation, since situational interest partially depends on observable situation characteristics, such as novelty or surprising information (Hidi & Renninger, 2006), while other constructs may be more person-specific and difficult to observe, such as questions concerning the students’ current feeling of competence or frustration. In part, the here proposed design helps detecting and studying such differences between constructs by quantifying the degree to which students agreed in their agreements on different constructs. Nevertheless, it is important to bear in mind that a lack of agreement can have many different sources, either rooted in the construct itself being person-specific, or rooted in individual distractions, individual misunderstandings of items, or individualised instructions.
A general limitation of assessments during ongoing lessons is the risk that the interruptions through surveys, however short, may interfere with the students’ attention and learning. This affects all in-the-moment self-reports during classes and consequently most experience sampling method studies conducted in school or university. The here proposed method offers a way out: If it is applied in school, where classes are typically smaller than in university lectures, then all students can be surveyed at the same time and the teacher can stop teaching for the time being. This would still imply an interruption and potential loss of attention, but one that the teacher could afterwards address and try to mitigate, for instance by repeating core messages. In university lectures however, where we suggested to survey different groups of students at different times, it cannot be ruled out that some students might miss an important detail while completing the survey. Teachers who are informed about the survey schedule may want to provide the information presented during survey times afterwards in a format that the student can read and repeat after the lecture, to catch up with any potentially missed information. Future studies should examine whether brief interruptions by ESM surveys interfere with students’ learning in school or university. If surveys and teaching occur simultaneously, it cannot be ruled out that the need to split one’s attention may impair the accuracy / validity of the students’ situational self-report or lead to a selective missing data pattern if students decide not to answer in those learning situations they find most difficult and attention demanding.
There is no guarantee that there be only one group agreement on a given question in a given situation. There might be multiple subgroups, each with their own mean score / agreed-upon rating. While this would be easy to detect in the violin plot, it poses a limitation to the idea of using the group mean score as the one and only indicator of objective situation characteristics.
If researchers were interested in comparing the groups A, B, and C with each other or make sure that they are comparable, then it would be recommendable to modify the assessment schedule proposed in Figure 2 in a way that assesses two groups simultaneously. With the here-proposed schedule, it would be possible to determine whether group A reported generally higher interest than group B or C, across all situations, by nesting situational assessments (level 1) in individuals (level 2) in groups (level 3), while ignoring the clustering in measurement time points. This procedure would reveal how much variance is due to differences between groups. Alternatively, a multi-group comparison with parameters constraint to be equal (e.g., Asparouhov & Muthén, 2012) could be used to test the assumption that groups were comparable in their mean scores, variances, or other, co-variance-based parameters. However, the procedures suggested in this article do not allow to disentangle the group-specific influence from the situation-specific influence in a given measurement time point, meaning if group A scores particularly high in the 37th minute of the class (see Figure 2), we do not know for sure if group B would have scored the same in a similar situation. If this information is needed for a research questions or application, we recommend to use planned missing data designs that systematically assess multiple (at least 2) groups at a time, in order to be able to compare them (see Enders, 2010). Please note that assessing multiple groups at a time either increases the burden and interruptions for participants, if the schedule is kept the same and the number of surveys is increased for individuals, or it implies fewer measurement time points across the lesson, if the number of individual surveys is kept constant.
Finally, it cannot be ruled out that surveying students’ in their learning situation changes the very process we aim to study (e.g., Schmitz & Perels, 2011). This should be kept in mind in all experience sampling method studies surveying students in class, as well in studies using introspective self-reports in general.
We mentioned above that the concept of concordant objectivity employed in this article implies that students assessed in a given situation agree, which in turn implies that their responses should form an uni-modal distribution. However, it is possible that students agree while forming heterogeneous subgroups, leading to a mixture, e.g., bi-modal distribution. For example, the 155 students in our lecture might have consisted of two groups, the ones loving the teacher, and the ones hating the teacher, which might have lead to the bi-modal responses observed in some situations. It is also possible, and apparently was the case in this study, that the form of the distribution of responses varies from moment to moment. It would, for instance, be possible that students form two separate groups in assessing a political statement, with one group of, e.g., conservative students rating the joke as funny and appropriate, and another group of, e.g., liberal, students rating the joke as not funny and inappropriate, or vice versa. Such an instance might cause a temporary bimodal distribution, while all other moments in the same lecture might see a uni-modal distribution as long as no politically connoted jokes are made. In moments in which the distribution is multi-modal, then it would be interesting to find out what caused the distribution. Understanding the reasons and mechanisms behind heterogeneity in responses in given situations is yet to be examined more systematically in future studies. In addition, the variance of the scores at each time point can be small or large, independent of the form of the distribution. For example, even in a study in which all distributions of scores at all measurement time points were uni-modal, the range of scores and the overall variance of scores could be large or small, and could differ from moment to moment. Figure 3 illustrates the size and change in variance between measurement time points in form of the red lines, which represent the standard deviation. Importantly, a mixed distribution (multimodal distribution) suggests multiple groups hiding behind an overall trend, which is highly relevant for personalised learning and person-oriented methods. Thus, apart of quantification of the variance, additional analyses, such as examinations of distributions and cluster/latent profile analyses could complement the search for reasons and mechanisms behind heterogeneity in responses in given situations.
In this study we found that only 7% of the variance was due to changes in the situation-specific group mean score from one moment to another. While this might seem to suggest that it might not matter so much how a university teacher teaches, we would like to offer alternative interpretations and directions for future research: On one hand, we do not know whether seminars or practical courses at university, which allow for more diverse, hands-on learning experiences than lectures, might have differed more strongly in their average motivation from one moment to another. Our findings only suggest that the lecture examined in this study was relatively consistent in the average interest it elicited from one moment to another (which oscillated around 3 on a scale from 1 = does not apply to 4 = fully applies). Future studies could examine whether the diversity and distinctiveness of learning tasks in a university course can increase the variance due to differences between changes in the situation-specific group mean score from one moment to another. The fact that the largest proportion of variance (65%) was due to the individual, situation-specific component is a strong argument for personalised learning tools and other instruments that help teachers address the motivational heterogeneity they encounter in their university courses and classrooms. Individual students’ momentary motivation deviated much from the average motivation in a given moment in this lecture, and Figure 1 shows that in most moments, there were very interested as well as rather disinterested students present. While heterogeneity and individualised/personalised learning have been addressed increasingly in the literature on learning and instruction in schools (e.g., Banister et al., 2014; Bingham et al.,2018), there is still a need to implement personalised learning procedures in university teaching.
It should be noted that in this article, we do not make use of the longitudinal nature of the ESM data, because that was beyond the article’s main scope, which focused on the distinction between subjective and objective components in self-reports. Nevertheless, the here-proposed method also has interesting implications for the longitudinal study of learning and teaching processes. Our method allows to study the following longitudinal questions: How does the construct of choice (here: situational interest) change within a lesson, within a person, over 30 minutes? How does the construct of choice change in one session of a lecture, across individuals, over 9 minutes? How does the construct of choice change from one week to another, over the course of a semester, on average across individuals or within individuals? Reitzle and Dietrich (2019) give an overview of possible longitudinal models that can be used to examine such questions, using the data described in this article and providing corresponding R and Mplus scripts.
While the methods proposed in this article attempt to contribute to further developments of personalised learning and interventions based on momentary assessments, it is important to keep in mind that much more research is needed to get from assessments to valid and helpful interventions. As Bastiaansen et al. (2019) have shown, different teams of researchers can draw very different conclusions about needed interventions from the exact same intensive longitudinal dataset and its intra-individual analyses. Teams of software developers, methodologists, and educators will need to work together to identify valid and effective ways to draw conclusions about individual students’ emotional needs for support from data like ours, and about the best ways to deliver appropriate interventions in the appropriate moments.
Because of the general limitations of self-reports, it is important to validate self-report data gained with the here proposed research design by linking them to more objective, observable and behavioural data, such as video-recorded observations of the students’ behaviour or the teacher’s behaviour, psychophysiological data with relevance to emotions and motivation, such as mobile electrodermal resistance assessments or heart rate variability measures, verifiable information about students’ performance (ideally standardised test performance), absenteeism, school dropout and objective information about the students’ demographic background, such as their family’s household income.
If only self-report assessments are possible due to organisational or other constraints, then different question formats can help to avoid at least the biases typical to rating scales: For example, emotions could be assessed with both open-ended questions (“Please write down here how you currently feel”), which can be linked to rating scales after being automatically analysed with sentiment analyses tools (e.g., Silge & Robinson, 2017) or manual coding (e.g., Moeller et al., 2018). Researchers and practitioners around the globe work on methods to gather objective information about participants’ emotions and motivations. For example, there are studies and companies that retrieve information about people’s emotions from their voices (e.g., Krothapalli & Koolagudi, 2013), countless companies and data scientists analyse texts produced by participants for markers of emotions in so-called sentiment analyses (e.g., Altrabsheh et al., 2013), wearable heart rate variability sensors are marketed to researchers and private users with the promise that they will provide objective information about the stress, sleep, recovery, and physical exercise of the wearer (e.g., Firstbeat, 2012). Multiple sensors are integrated to optimise predictions of behaviour and emotions, and machine learning algorithms help integrate all these data, reaching never before seem accuracies in predicting emotions and behaviour (e.g., Carroll et al., 2013).
On the other hand, a recently emerging debate has questioned whether the subjective information about personal experiences provided by self-reports can be entirely replaced by objective measures, since e.g., Barrett (2018) has suggested that even the presumably objective markers of emotions are to some extent idiosyncratic. For these reasons, we might have to keep asking people for their self-reports if we really want to know how an individual feels in a given situation, since the subjective evaluation, a crucial part of the emotional experience, is not always captured in the observable and behavioural measures.
For these reasons, we believe that the research design proposed here will remain a useful tool to examine in the future to what degree a given ESM response in a given situation was idiosyncratic and thus a reflection of person-specific characteristics, or in line with the assessments of other students in the same situation. We hope that the indicators of concordant objectivity proposed here can be compared and integrated with other objective measures of emotions and motivation in learning situations in the future, in order to improve predictions of students’ learning and behaviour. There is a large array of constructs that could be assessed in line with the here-proposed person-object logic (Figure 1) and schedule for disentangling the subjective and concordant-objective aspects of participants’ situational self-reports. Apart from the example of interest discussed throughout this article, the method promises to be insightful also for constructs such as perceived teacher behaviour, students’ rating of teaching quality (see e.g., Göllner et al., 2018), or perceived situation or classroom characteristics (e.g., task difficulty, social climate, see e.g., Lüdtke et al., 2009).
This research has been supported by a Jacobs Foundation Early Career Research Fellowship awarded to the first author. We thank our reviewers for very thoughtful and appreciative feedback.
Altrabsheh, N., Gaber, M. M., & Cocea, M. (2013). SA-E:
Sentiment analysis for education. In: R. Neves-Silva, J. Watada,
G. Philipps-Wren, L. C. Jain, & R. J. Howlett (Eds.), Intelligent
Decision Technologies (pp. 353 - 362), Amsterdam: IOS
Press. doi: 10.3233/978-1-61499-264-6-353
Asparouhov, T., & Muthén, B. (2012). Multiple group multilevel
analysis. Mplus Web Notes: No. 16. Retrieved March 5, 2020 from
https://www.statmodel.com/examples/webnotes/webnote16.pdf
Asparouhov, T. & Muthén, B. (2019). Comparison of models for
the analysis of intensive longitudinal data,Structural
Equation Modeling: A Multidisciplinary Journal, 00:
1–23. https://doi.org/10.1080/10705511.2019.1626733
Banister, S., Reinhart, R., & Ross, C. (2014). Using digital
resources to support personalized learning experiences in K-12
classrooms: The evolution of mobile devices as innovations in
schools in Northwest Ohio. In M. Searson & M. Ochoa (Eds.),
Proceedings of Society for Information Technology & Teacher
Education International Conference 2014 (pp. 2715-2721) .
Chesapeake, VA: Association for the Advancement of Computing in
Education. Retrieved March 5, 2020 from
https://www.learntechlib.org/primary/p/131202/ .
Bastiaansen, J. A., Kunkels, Y. K., Blaauw, F., Boker, S. M.,
Ceulemans, E., Chen, M., … Bringmann, L. F. (2019, March 21). Time
to get personal? The impact of researchers’ choices on the
selection of treatment targets using the experience sampling
methodology. Preprint retrieved on August 24, 2019 from
https://doi.org/10.31234/osf.io/c8vp7
Bingham, A. J., Pane, J. F., Steiner, E. D., & Hamilton, L. S.
(2018). Ahead of the curve: Implementation challenges in
personalised learning school models. Educational Policy,
32(3), 454 – 489. https://doi.org/10.1177/0895904816637688
Barrett, L. F. (2018). How emotions are made. The secret life
of the brain. Mariner Books: New York.
Battle, A., & Wigfield, A. (2003). College women’s value
orientations toward family, career, and graduate school. Journal
of Vocational Behavior, 62, 56–75.
https://doi.org/10.1016/S0001-8791(02)00037-4
Beretvas, S. N. (2010). Cross-classified and multiple membership
models. In J. J. Hox & J. K. Roberts (Eds.), Handbook of
advanced multilevel analysis (pp. 313–334). New York, NY:
Routledge.
Bieg, M., Goetz, T., Wolter, I., & Hall, N. C. (2015). Gender
stereotype endorsement differentially predicts girls' and boys'
trait-state discrepancy in math anxiety. Frontiers in
Psychology, 6, 1404.
https://doi.org/10.3389/fpsyg.2015.01404
Carroll, E. A., Czerwinski, M., Roseway, A., Kapoor, A., Johns,
P., Rowan, K., & Schraefel, M. C. (2013). Food and mood:
Just-in-time support for emotional eating. 2013 Humaine
Association Conference of Affective Computing and Intelligent
Interaction . Geneva, Switzerland.
Chauliac, M; Catrysse, L. ; Gijbels, D. & Donche V. (2020). It
is all in the surv-eye: can eye tracking data shed light on the
internal consistency in self-report questionnaires on cognitive
processing strategies? Frontline Learning Research. 8
(3), 26 – 39. https://doi.org/10.14786/flr.v8i3.489
Chung, H., Kim, J., Park, R., & Jean, H. (2018). The impact of
sample size in cross-classified multiple membership multilevel
models. Journal of Modern Applied Statistical Methods, 17 (1),
Article 26. https://doi.org/10.22237/jmasm/1542209860
Cole, J. S., Bergin, D. A., & Whittaker, T. A. (2008).
Predicting student achievement for low stakes tests with effort
and task value. Contemporary Educational Psychology,
33, 609–624. https://doi.org/10.1016/j.cedpsych.2007.10.002
Corno, L. (2008). On teaching adaptively. Educational
Psychologist, 43(3), 161–173.
https://doi.org/10.1080/00461520802178466
Creswell, J. W. & Guetterman, T. C. (2019). Educational
research: Planning, conducting, and evaluating quantitative and
qualitative research , 6th edition, Pearson.
Dietrich, J., Viljaranta, J., Moeller, J., & Kracke, B.
(2017). Situational expectancies and task values: Associations
with students' effort. Learning and Instruction, 47,
53–64. https://doi.org/10.1016/j.learninstruc.2016.10.009
Dietrich, J., Moeller, J., Guo, J., Viljaranta, J., & Kracke,
B. (2019a). In-the-moment profiles of expectancies, task values,
and costs. Frontiers in Psychology, 10:1662.
https://doi.org/10.3389/fpsyg.2019.01662
Durik, A. M. & Jenkins J. S. (2020). Variability in Certainty
of Self-Reported Interest: Implications for Theory and Research. Frontline
Learning Research. 8 (3) 85-103.
https://doi.org/10.14786/flr.v8i3.491
Douglas, H., (2011). Facts, values, and objectivity. In: I. Jarvie
& J. Zamora Bonilla (eds.), The SAGE Handbook of
Philosophy of Social Science, 513–529, London: SAGE
Publications.
Durik, A. M., Vida, M., & Eccles, J. S. (2006). Task values
and ability beliefs as predictors of high school literacy choices:
A developmental analysis. Journal of Educational Psychology,
98, 382–393. https://doi.org/10.1037/0022-0663.98.2.382
Eccles, J. S., Adler, T. F., Futterman, R., Goff, S. B., Kaczala,
C. M., Meece, J. L., & Midgley, C. (1983). Expectancies,
values, and academic behaviors. In J. T. Spence (Ed.), Achievement
and achievement motives (pp.74–146). San Francisco, CA:
Freeman.
Eccles, J. S., & Wigfield, A. (2002). Motivational beliefs,
values, and goals. Annual Review of Psychology, 53,
109–132. https://doi.org/10.1146/annurev.psych.53.100901.135153
Efron, B. and Tibshirani, R. (1993) An Introduction to the
Bootstrap. Chapman and Hall, New York, London.
Eisner, E. (1992). Objectivity in educational research. Curriculum
Inquiry, 22(1), 9-15.
https://doi.org/10.1080/03626784.1992.11075389
Enders, C. K. (2010). Applied missing data analysis. New
York, NY: The Guilford Press.
Fahrenberg, J. (1996). Ambulatory assessment: Issues and
perspectives. In: Fahrenberg, J. & Myrtek, M. (Eds.). (1996).
Ambulatory Assessment: Computer-assisted Psychological and
Psychophysiological Methods in Monitoring and Field Studies (pp.
3 – 20) . Seattle, WA: Hogrefe and Huber. University of
Freiburg i. Br., Germany
Fink, B. (1991). Interest development as structural change in
person-object relationships. In: Oppenheimer L., Valsiner J. (eds)
The Origins of Action. Springer, New York, NY.
https://doi.org/10.1007
Firstbeat (2012). Heart beat based recovery analysis for athletic
training. Firstbeat Whitepapers. Retrieved from:
http://www.firstbeat.fi/physiology/white-papers
Fisher W. P. Jr. (2000). Objectivity in psychosocial measurement:
what, why, how. Journal of Outcome Measurement, 4(2),
527-563.
Fryer, L. K. &
Nakao K. (2020). The Future of Survey Self-report: An experiment
contrasting Likert, VAS, Slide, and Swipe touch interfaces. Frontline
Learning Research, 8 (3),10-25.
https://doi.org/10.14786/flr.v8i3.501
Glanzberg, M. (2018). Truth. In: Edward N. Zalta (ed.), The
Stanford Encyclopedia of Philosophy (Fall 2018 Edition),
Retrieved from
https://plato.stanford.edu/archives/fall2018/entries/truth/
Göllner, R., Wagner, W., Eccles, J. S., & Trautwein, U.
(2018). Students’ idiosyncratic perceptions of teaching quality in
mathematics: A result of rater tendency alone or an expression of
dyadic effects between students and teachers? Journal of
Educational Psychology, 110(5), 709–725.
https://doi.org/10.1037/edu0000236
Goetz, T., Bieg, M., Lüdtke, O., Pekrun, R., & Hall, N. C.
(2013). Do girls really experience more anxiety in mathematics? Psychological
Science, 24(10), 2079-2087.
https://doi.org/10.1177/0956797613486989
Green, A. S., Rafaeli, E., Bolger, N., Shrout, P. E., & Reis,
H. T. (2006). Paper or plastic? Data equivalence in paper and
electronic diaries. Psychological Methods, 11, 87–105.
https://doi.org/10.1037/1082-989X.11.1.87
Hartigan, J. A., & Hartigan, P. M. (1985) The dip test of
unimodality. Annals of Statistics, 13, 70–84.
Hektner, J. M., Schmidt, J. A., & Csikszentmihalyi, M. (2007).
Experience sampling method. Measuring the quality of everyday
life . Thousand Oaks, CA, US: Sage Publications.
Hidi, S., & Renninger, K. A. (2006). The four-phase model of
interest development. Educational Psychologist, 41,
111-127. https://doi.org/10.1207/s15326985ep4102_4
Ketonen, E., Dietrich, J., Moeller, J., Salmela-Aro, K., &
Lonka, K. (2018). The influence of autonomous and controlled daily
goals on positive and negative emotional states: An experience
sampling approach. Learning and Instruction, 53, 10-20.
https://doi.org/10.1016/j.learninstruc.2017.07.003
Krapp, A. (1998). Entwicklung und Förderung von Interessen im
Unterricht [Development and promotion of interest in instruction].
Psychologie in Erziehung und Unterricht, 45, 186-203.
Krapp, A. (2002). Structural and dynamic aspects of interest
development: theoretical considerations from an ontogenetic
perspective. Learning and Instruction, 12(4), 383-409.
https://doi.org/10.1016/S0959-4752(01)00011-1
Krapp, A., & Fink, B. (1992). The development and function of
interests during the critical transition from home to preschool.
In K. A. Renninger, S. Hidi, & A. Krapp (Eds.), The role
of interest in learning and development (pp. 397–429).
Hillsdale, NJ: Lawrence Erlbaum Associates.
Krapp, A., Hidi, S., & Renninger, K. A. (1992). Interest,
learning and development. In K. A. Renninger, S. Hidi, & A.
Krapp (Eds.), The role of interest in learning and
development (pp. 3–25). Hillsdale, NJ: Lawrence Erlbaum
Associates.
Krothapalli, K. S. & Koolagudi, S. G. (2013). Emotion
recognition using speech features. London: Springer
Lüdtke, O., Robitzsch, A., Trautwein, U., Kunter. M. (2009).
Assessing the impact of learning environments: How to use student
ratings of classroom or school characteristics in multilevel
modeling. Contemporary Educational Psychology 34,
120–131. https://doi.org/10.1016/j.cedpsych.2008.12.001
Maechler, M. (2016). Package ‘diptest’. Hartigan's dip test
statistic for unimodality – Corrected . R package.
Retrieved March 5, 2020 from
https://cran.r-project.org/web/packages/diptest/diptest.pdf
Moeller, J., Dietrich, J., Viljaranta, J., & Kracke, B.
(2019). Data, R and Mplus codes for disentangling objective
characteristics of learning situations from subjective perceptions
thereof, using an experience sampling method design. Rerieved
from https://osf.io/yszvm/.
https://doi.org/10.17605/OSF.IO/YSZVM
Moeller, J., Ivcevic, Z., White, A., & Brackett, M. A. (2018).
Mixed emotions: network analyses of intra-individual
co-occurrences within and across situations. Emotion,18(8),
1106-1121. https://doi.org/10.1037/emo0000419
Popper, K. R. (1934 [2002]), Logik der Forschung [The Logic
of Scientific Discovery], Berlin: Akademie Verlag.
Prenzel, M., Krapp, A. & Schiefele, H. (1986). Grundzüge einer
pädagogischen Interessentheorie [Outline of an educational
interest theory]. Zeitschrift für Pädagogik, 32(2),
163-173.
Reitzle, M. & Dietrich, J. (2019). From between-person
statstics to within-person dynamics. Diskurs Kindheits- und
Jugendforschung, 3-2019, 319-339.
https://doi.org/10.3224/diskurs.v14i3.06
Schmitz, B. & Perels, F. (2011). Self-monitoring of
self-regulation during math homework behaviour using standardized
diaries. Metacognition & Learning, 6, 255-273.
https://doi.org/10.1007/s11409-011-9076-6
Schönbrodt, F. D. & Perugini, M. (2013). At what sampe size do
correlations stabilize? Journal of Research on Personality,
47, 609-612. https://doi.org/10.1016/j.jrp.2013.05.009
Shiffman, S., Stone, A. A., & Hufford, M. R. (2008).
Ecological momentary assessment. Annual Review of Clinical
Psychology, 4, 1-32.
https://doi.org/10.1146/annurev.clinpsy.3.022806.091415
Silge, J. & Robinson, D. (2017). Text mining with R: A
tidy approach. Sebastopol, CA: O’Reilly
Takarangi, M. K. T., Garry, M., & Loftus, E. F. (2006). Dear
diary, is plastic better than paper? I can’t remember: Comment on
Green, Rafaeli, Bolger, Shrout, and Reis (2006). Psychological
Methods, 11, 119 –122.
https://doi.org/10.1037/1082-989X.11.1.119
Tibshirani, R. & Leisch, F. (2019). bootstrap: Functions
for the Book "An Introduction to the Bootstrap. R
package .
https://cran.r-project.org/web/packages/bootstrap/index.html
Wickham, H., Chang, W., Henry, L., Pedersen, T. L., Takahashi, K.,
Wilke, C., & Woo, K. (n.d.). Jittered points. Retrieved from:
https://ggplot2.tidyverse.org/reference/geom_jitter.html
Wickham, H. (2016). Ggplot2: Elegant graphics for data
analysis
. Springer-Verlag New York.