![]()
Frontline Learning Research Vol.8 No. 3 Special
issue (2020) 140 - 163
ISSN 2295-3159
aVrije Universiteit Amsterdam,
the Netherlands
bOpen Universiteit, the Netherlands
cDIPF | Leibniz Institute for Research and Information
in Education, Frankfurt, Germany
dHogeschool Zuyd, the Netherlands
Article received 29 May 2019/ revised 26 July / accepted 17 September/ available online 30 March
For decades, self-report instruments – which rely heavily on students’ perceptions and beliefs – have been the dominant way of measuring motivation and strategy use. Event-based measures based on online trace data arguably has the potential to remove analytical restrictions of self-report measures. The purpose of this study is therefore to triangulate constructs suggested in theory and measured using self-reported data with revealed online traces of learning behaviour. The results show that online trace data of learning behaviour are complementary to self-reports, as they explained a unique proportion of variance in student academic performance. The results also reveal that self-reports explain more variance in online learning behaviour of prior weeks than variance in learning behaviour in succeeding weeks. Student motivation is, however, to a lesser extent captured with online trace data, likely because of its covert nature. In that respect, it is of importance to recognize the crucial role of self-reports in capturing student learning holistically. This manuscript is ‘frontline’ in the sense that event-based measurement methodologies with online trace data are relatively unexplored. The comparison with self-report data made in this manuscript sheds new light on the added values of innovative and traditional methods of measuring motivation and strategy use.
Keywords: Self-Regulated Learning; Self-Report Measures; Event-Based Measures; Online Trace Data
Motivation and strategy use are core concepts in the literature on learning and instruction. Widely known and prominent in contemporary educational psychology is the theory of Self-Regulated Learning (SRL), which integrates these constructs in explaining student success. SRL can be defined as “an active, constructive process of goal setting and attempting to monitor, regulate, and control cognition, motivation, and behaviour, guided and constrained by goals and the contextual features in the environment” (Dinsmore et al., 2008; Jupp, 2006; Panadero et al., 2016; Panadero, 2017; Pintrich, 2000, p. 453). SRL is an internal process that we cannot directly access, such that proxies are necessary to assess this SRL process (Boekaerts & Corno, 2005).
For decades, it has been argued that aptitude-based self-report instruments – which rely heavily on students’ perceptions and beliefs – do not fully capture SRL. Theories of SRL emphasize that each instance of self-regulation is a function of the individual’s dynamic interaction with the learning environment, but few instruments satisfactorily capture such data (Boekaerts et al., 2000; Efklides, 2011; Veenman, 2011; Winne & Perry 2000). Yet, self-reports have remained the dominant way of measuring SRL (Boekaerts & Corno 2005; Winne and Perry 2000), as the implementation of more time-intensive data collection methods, such as thinking-aloud protocols, event-based self-reports, or observations, are often times not feasible in educational settings. The recent introduction of tracing methods in online learning environments mainly through learning analytics (Greller & Drachsler, 2012) sparked the development of an alternative event-based measurement method of SRL, enabling a form of online observation methods, while influencing the learning process as little as possible (Panadero et al., 2016). These measurement methods are spurred by active efforts in the learning analytics community to bridge the gap between learning sciences and data analytics. However, so far learning theories such as SRL are seldom used as theoretical basis for the design and evaluation of tracing methods (Jivet et al., 2017; Jivet et al., 2018). Furthermore, there is a dearth of empirical work into the potential of online observation methods to complement self-reports on SRL. The purpose of this study is therefore to triangulate constructs suggested in SRL theory and measured using aptitude-based self-reported data with revealed online traces of learning behaviour.
This study takes place in the context of the implementation of a Learning Analytics application, called ‘the Learning Analytics Experiment’ in Dutch higher education. The main aim of the project was to create an opportunity for institutions, teachers, and students to gain experience with different facets of learning analytics (e.g. privacy, feedback provision, insight in the use of learning materials, etc.). The online traces of students’ learning behaviour were recorded using xAPI (or Tin Can) trackers, which have the potential to track learning experiences and store records of learners’ (e.g. ‘access video’ or ‘receive grade’). The trackers used in this study captured information specifically on the use of learning materials, such that the use of the online learning environment can be compared between students over time in light of different components of SRL. This study describes an implementation of the xAPI trackers in a mandatory first-year statistics course at a Dutch university, during two consecutive academic years. During the implementation, self-reports on motivation and strategy use were collected to triangulate the trace data. This offered a rich case to unpack the aggregated data collected with self-reports and to, vice versa, colour the trace data with self-reports on motivation and strategy use. Accordingly, this study aims to shed light on two of the central questions addressed in this special issue: In what ways do self-report instruments reflect the conceptualizations of the constructs suggested in theory related to motivation or strategy use? And: How does the use of self-report constrain the analytical choices made with that self-report data?
Online learning environments are central in today’s higher education, as they not only form a learning portal for a variety of purposefully selected learning resources, but also help to navigate through the course, enable students to be in contact with the instructor and peers, and to engage in various learning activities in a student-led fashion (Lust et al., 2012; Molenda, 2008). Students leave traces when interacting with these online learning environments. Trace data can be defined as “observable evidence of particular cognitions that are obtained at points where a cognitive process is applied while completing a task” (Howard-Rose & Winne, 1993, p. 594). A growing body of literature confirms the importance for online learning environments for learning outcomes. Gašević et al., 2014), for example, showed that the number of logins, number of operations performed on discussion forums and resources accounted for approximately 21% of the variance in academic performance. This finding is in line with earlier research on the relation between the frequency of visits to an online learning environments and students’ academic performance (Coogan et al., 2005; DeNeui & Dodge, 2006; Wang & Newlin, 2000). Models on SRL provide a holistic theoretical foundation for the relation between observed student behaviour in online learning environments and academic performance, based on the cognitive, metacognitive, behavioural, motivational, and affective aspects of learning (Panadero, 2017). One of the latest meta-analyses on the effect of SRL (Sitzmann and Ely, 2011) shows that the four biggest predictors of learning gains — goal level, persistence, effort, and self-efficacy — have a significant motivational value. Longitudinal investigation of the interaction between motivation, strategy use, and the learning environment is, however, scarce (Panadero, 2017).
There are several reasons to believe that online trace data hold potential for tapping into the process of SRL. Students (especially in higher education) are the agents in online environment usage: they determine which resources are used and how these resources are used. The effects of the instructional design of a learner’s environment are therefore never deterministic, since the use of the environment depends on the personal goals, motivation, and volition of the student (Winne & Baker, 2013). Usage of online environment can be considered a skill in itself, as it requires a repertoire of learning strategies, confidence, and competences. As Lust and colleagues (2012) put it, online environments are only beneficial when learners recognize the learning resources as a learning opportunity for which they are motivated to spent effort and time on. In other words, effective use of online learning environments can be conceptualized as a manifestation of SRL. The extent to which an individual student is motivated and able to self-regulate their learning process is thus a prerequisite for effective tool-use (Winne & Baker, 2013; Lust et al., 2012). In addition, and elaborately described by Fryer (2017), the relation between motivation, strategy use, and the use of learning environments can be conceptualized as reciprocal. Namely, learning activities undertaken in the process phase of learning, as well as the resulting product of learning, feed back to students’ beliefs, attitudes, and ideas around motivation, strategy use, and self-regulation that play a role in the presage stage of learning. Online trace data, thus, reflects the dynamic relation between students and their learning experiences over time.
An event-based measure of SRL with online trace data arguably has the potential to remove analytical restrictions of aptitude measures. Firstly, and according to the overconfidence effect, unrealistically favourable attitudes that people have towards themselves (Taylor & Brown, 1988) can impose an upward bias in self-reports of motivation and strategy use. In other words, students might apply less and less effective study strategies than self-reported. Zhou and Winne (2012) confirm this theory empirically by showing that “trace data”-based measures of student achievement goal orientation were much stronger associated with learning outcomes than with self-reported ones. This is particularly pressing since existing research suggests that learners tend to use ineffective learning strategies (Jamieson-Noel & Winne, 2003), and do not make effective use of available resources to optimize their learning, even in those environments that build on effective learning designs (Ellis et al. 2005; Lust et al., 2013). As discussed in this special issue, potential reasons are students’ cognitive processing capacity (Chauliac et al. 2020), exerted effort (Iaconelli & Wolters 2020), and student characteristics (Vriesema 2020). Comparing self-reported data with online traces of learning behaviour taps right into a potential upward bias in self-reports on motivation and strategy use. Since online traces of learning behaviour do not suffer from socially desirable responding bias, it is possible that they provide a better approximation of motivation and strategy use. Secondly, inventories are restricted as they often predetermine the level of aggregation in the analysis of data on motivation and strategy use (e.g. fixed at student-level), which, as a result, generates student-focussed or aptitude-based measures. This jeopardizes the potential of adapting effectively to individual needs and preferences during a study episode or educational program. Alongside self-report instruments that operationalized motivation and self-regulation as event-bound (Winne, 2010), event-based trace data of learning behaviour can provide a dynamic insight in how motivation and strategy use does not only vary between students, but also within students over time. This is particularly relevant since previous research show that self-motivational beliefs and strategy use can vary considerably over the course of a study episode, or throughout the educational program (Boekaerts et al., 2000; Efklides, 2011; Veenman, 2011; Winne & Perry 2000). One example is presented in this special issue by Moeller et al. 2020, in their study on this intra-individual variation in self-motivational beliefs.
Up until now, empirical studies on SRL that use online trace data often aim at identifying different patterns of usage behaviour. This has led to a wide variety of student typologies aiming at a better understanding of the type of learning strategies used by students, looking at the use of information-tools (such as forums, instruction video’s, and interactive mind maps) over the duration of a course (Heffner & Cohen, 2005; Hoskins & van Hooff, 2005; Huon et al, 2007). Examples of typologies are the active and passive users of forums (Hoskins & van Hooff, 2005); the early-, constant-, and late users (Knight, 2010; Lust et al., 2012); the low-, average-, and high frequency users (Bera & Liu, 2006; Jiang et al. 2009). Research methods in identifying learning strategies inferred from online trace data evolve rapidly. A recent strand of research on trace data adopts data mining techniques in detecting striking, previously unknown, patterns in study tactics and strategy use (Han et al., 2011). In general, it remains a challenge to qualify these patterns, typologies, and clusters of study tactics, and to make these insights actionable for instructional design accordingly. So far, studies repeatedly find that usage patterns do explain variance in academic performance (e.g. Cho & Yoo, 2017; Cornelisz & van Klaveren, 2018; Gašević et al., 2014; Han et al., 2011; Schmitz et al., 2018), but what type of self-regulation it represents and the quality thereof remains a black box. Only a handful of studies focussed on triangulation of self-reports specifically on SRL using online trace data of student learning. The few studies that describe a quantitative comparison of self-reports on SRL and online trace data show that the relation between these two sources of data is not straightforward. Hadwin et al. (2007) used ten relevant items from the motivated Strategies for Learning Questionnaire (MSLQ) on strategy use to explain students’ learning in gStudy, a web-based learning environment in which students read texts, summarize, and use concept maps in an introductory educational psychology course (N = 188). They clustered students into four groups based on self-reported SRL data and found their actual learning patterns in gStudy differed substantially, even among students from the same cluster. Kim et al. (2018) made a similar comparison among undergraduates in Korea. They analysed online trace data from 284 undergraduate students enrolled in an asynchronous online statistics course. Based on self-reports collected with the MSLQ, students were classified as fully, partially, or not self-regulating. Surprisingly, this distinction did not reveal different patterns in online traces of learning. The main difference between the groups was timing in study behaviour, students classified as not self-regulating studied mainly shortly before the examination, which was negatively related to academic performance. A study of Guerra et al. (2016) used the achievement-goal questionnaire and online trace data (N = 89). Their study shows that students who report a high mastery-approach show a higher level of activity in the online learning environment. There results also suggest that highly motivated students are more sequential in their patterns of navigation, which means students are less likely to follow the suggested order of topics to study. Cho & Yoo (2017) adopted a different approach and compared precision in prediction of students’ academic performance based on patterns in self-reports based on MSLQ and patterns in online trace data established with data mining techniques (N = 60). The model based on online trace data provided a more precise prediction. The authors note that this might be partially due to the fact that the trace data provided more variables and was based on a bigger data set. Also, the study did not address whether or not it is likely that the self-reports and online trace data actually measured the same constructs. Like in the studies described earlier, the inventory is aptitude-based (Muis et al., 2007; Zimmerman, 2008), whereas the online trace data is event-based. In this special issue, Rogiers, Merchie, and Van Keer present one of the first studies in this space that compares event-based self-report data with trace data. Overall, the interpretation of online trace data in light of self-reports is not clear-cut, there are many questions left unanswered about the relationships between the constructs measured with an instrument such as the MSLQ and online trace data collected in different education settings.
The aim of this study is to further explore the relationship
between measures of SRL through self-reports and online trace
data, by scrutinizing variance in self-reports and online trace
data between and within students. Because the online traces of
learning behaviour are event-based, our study provides a dynamic
insight in how motivation and strategy use vary between and within
students over time. The findings are instrumental in guiding
innovations in education towards effective personalized learning.
Accordingly, the following research questions are formulated for
this study:
1. To what extent do self-reports explain variance in online trace
data of learning behaviour?
2. How stable is the relation between self-reports and online
trace data throughout the various weeks of the course?
3. How well do self-reports explain student performance in
comparison to online trace data?
Following Fryer (2017), we expect that self-reports on motivation, strategy use, and self-regulation gauge between-student differences in the presage stage and that online trace data gauges the process phase of learning. With respect to the first research question, it can, therefore, be expected that self-reports explain substantial variance in learning behaviour observed through online trace data. Furthermore, student differences in the presage stage will likely be affected over time by the feedback loop between the presage, process, and product phase. Therefore, it can be expected that the self-reports predict online learning behaviour most precisely at the time the self-reports are administered. With respect to research question two, thus, we expect that the relationship between self-reports and online trace data varies over time. Finally, in light of the third research question, we expect online trace data to explain an equal amount or more variation in student performance than self-reports, in line with the findings of Cho and Yoo (2017).
This study adds to the existing literature as follows. Firstly, there are only a few studies so far that tapped into the relationship between self-reports and online trace data. Given the sensitivity of the usage patterns to the instructional design of an online learning environment (Gašević et al., 2016), it is of great importance that a broad range of educational settings are explored with online trace data. The course, instructional design, and educational setting investigated in this study is considered particularly relevant because it is highly representative for other courses in mainstream Dutch higher education and since this particular course plays a crucial role in all social science programs in the Netherlands. In addition, this study compares multiple cohorts, which yields insight in continuity and change of strategy use with the constant evolvement of course design. Secondly, the few studies that have been comparing self-reports and online trace data so far dealt with relatively small sample sizes (Cho & Yoo, 2017; Guerra et al., 2016; Hadwin et al., 2007; Kim et al., 2018) or did not measure the full range of self-motivational beliefs and strategies with self-reports (Hadwin et al., 2007; Cho & Yoo, 2017). As a result, there is no clarity, yet, on the relevance and actionability of online trace data in comparison to inventories on motivation, strategy use, and self-regulation.
The data used consist of self-reports and detailed log-data on SRL, collected among two cohorts of first year students at the Faculty of Behavioural and Movement Sciences during a mandatory statistics course that took place between October and December 2016 (N = 435; 94.44% female, Mage = 20.60 years, SD = 5.18) and 2017 (N = 489; 78.90% female, Mage = 20.88 years, SD = 3.48). The 2017 cohort included international students, as this was the first year that this course was also taught in English. The Faculty of Behavioural and Movement Sciences offers the following educational programs: movement sciences, education sciences and behavioural, developmental and clinical psychology.
4.2.1 Online learning environment
The online learning environment was available to all students throughout the course and its usage was not mandatory in any sense. In 2016, the online learning environment consisted of a learning management system (Blackboard) and a separate online learning tool, called I Hate Statistics . Blackboard is one of the leading commercial LMS software packages used by North American and European universities (Itmazi & Megias, 2005; Munoz & Duzer, 2005). From the start of the academic year 2017-2018, the institution switched to a new learning management system, called Canvas. Together with the standard features of LMSs, Canvas provides advanced options like learning outcomes, peer review, migration tools, e-portfolios, screen sharing and video chat etc. Canvas is gaining popularity, hundreds of colleges, universities, and school districts currently use this package (www.instructure.com).
Across cohorts, the learning management system was structured in a similar fashion. Both Blackboard and Canvas provided students with three types of tools: 1) an information tool (lecture slides, instruction video’s, and general course information), which provided the course content in a structured way; 2) a cognitive tool for self-assessments that enabled students to interact with the subject matter, to assess and to reflect on the learning content; and 3) a communication tool (forums) that enabled students to communicate with peers and instructors (Lust et al., 2012). The tools were structured based on the week-topics of the course and were available at all times throughout the course.
The learning management system referred students to ‘I Hate Statistics’, which provided students with an online environment for practicing and studying, where students could engage in lessons, challenges, and self-assessments that were related to the week topics, or to other topics that were available in this environment. Each challenge consisted of on average maximal ten questions; yet, the challenge was automatically finished when students correctly answered five questions within the challenge. A unique feature of the environment was that it is built around the statistics course and offered content in a particular week that was similar to the content offered in the lectures and seminars.
The xAPI tracking method is applicable for all online learning environments (see for example https://xapi.com/). In the context of this study, it was used to gain insight into the use of learning materials in the learning management systems. The teacher created so-called 'recipes' and placed them in Blackboard, where the use of information resources and participation in online activities were tracked. These recipes ensured that the desired statistics were generated, as well as information on the type of tool that was used (e.g. slides, challenges, lessons) an action verb (e.g. accessed, received), and a label (e.g. lessons on the chi-square test, lecture slides of week 1). A comparable tracking method was used in I Hate Statistics, which generated similar data about the use of the learning materials.
4.2.2 Instructional design
During the eight-week introductory statistics course, students had to attend two lectures each week in which theoretical concepts were addressed. Additionally, they had to attend one seminar each week with mandatory attendance in which the assignments and the subject matter were discussed and opportunities for peer- and teacher feedback were organized. Offline and in the course manual, students were referred to the textbook that the teacher selected as a starting point for the course. Use of this textbook is not traced within the online learning environment. The online learning environment provided opportunities for self-assessments. The self-assessments in the learning management systems and I Hate Statistics were similar in nature and contained multiple-choice questions in which knowledge and comprehension were assessed. The learning management system contained four self-assessments; I Hate Statistics contained eight self-assessments on the course topics. In the second year of this study, it also gave access to a practice exam, with questions that were representative for the final exam. At the end of the course (week 8) each student was graded based on a final multiple-choice exam and on a research report.
4.3.1 Self-reports
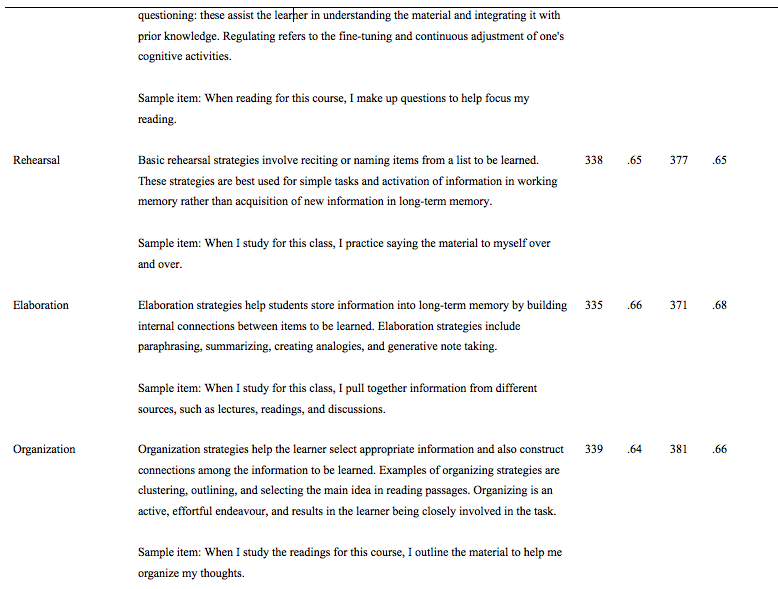
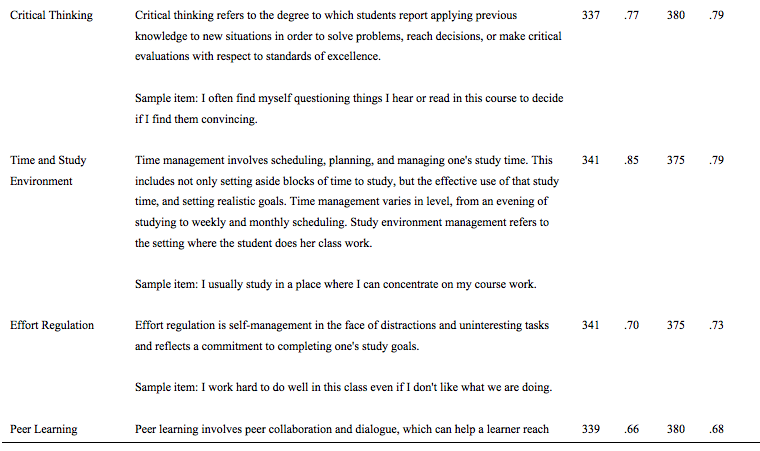
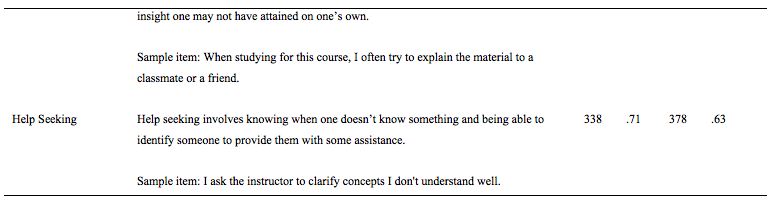
The motivated Strategies for Learning Questionnaire (MSLQ), a measure developed by Pintrich and colleagues (McKeachie et al 1985; Pintrich, 1991; Pintrich et al., 1987; see also Duncan and McKeachie, 2005, for a more in-depth discussion), was used to assess self-reports on SRL. The MSLQ was derived from an extensive body of literature and was one of the first inventory on the quality of student learning that not only included attitudes, motivation, and strategy use, but also self-regulatory strategies (Entwistle & McCune, 2004). The MSLQ was progressive at the time by including the dimension of students’ consciousness about the teaching-learning environment, leading to adaptation of ways to tackle academic work (Entwistle & McCune, 2004). Several studies argue that there is piecemeal evidence for the scale structure of the MSLQ (Hilpert et al., 2017), yet, to this date, this inventory for students in higher education is still considered relevant in light of the wide range of motivation, affect, strategy use, and self-regulation it covers. Appendix A provides a description of the scales, along with a couple of sample items per scale.
The MSLQ was administered once in the seminar of week four, along with several general questions about background variables, such as age and gender. The MSLQ contained 81 questions of which 31 items determined students’ motivational orientation towards the course and 50 items assessed metacognition. The questions assess the propensity of students to engage in self-regulated learning within the specific context of this course, but, overall, the MSLQ has been classified as an aptitude measure of self-regulated learning (Muis et al., 2007; Zimmerman, 2008). Students answered with a 7-points Likert scale, ranging from ‘not at all true for me’ to ‘very true for me’. The motivational orientation is divided into six subscales: Intrinsic goal orientation, extrinsic goal orientation, task value, self-efficacy, control beliefs and test anxiety. Metacognition was scored on nine subscales: rehearsal, elaboration, organization, critical thinking, metacognitive self- regulation, time and study environment, effort regulation, peer learning and help seeking. A definition per subscale is provided in Appendix A. For a complete description of the MSLQ and each of its subscales we refer to the manual of the MSQL (Pintrich, 1991).
Reliability coefficients were determined with the Cronbach’s Alpha (see Appendix A). It is important to note that the reliability of the goal orientation sub-scales is poor. Scrutinizing the data per item did not point out particular weak items that could be removed from the scale to improve reliability.
4.3.2 Online trace data
Online trace data was obtained as part of the project ‘the Learning Analytics Experiment’. The teacher of the course was actively involved in defining what type of data was collected. The teacher was facilitated to track any learning activity in the learning management system with trackers designed by SURFnet and the Amsterdam Center for Learning Analytics (ACLA). The trackers were based on xAPI recipes (a set of rules). The teacher defined the set of rules, based on activities, verbs, and labels. For example, ‘formative exam’ (activity) - ‘accessed’ (verb) - ‘week 3’ (label). After defining a recipe, a HTML-code was provided that accordingly was embedded in the online learning environment, often in the form of an empty object in the environment.
In addition, the designers of the application I Hate Statistics provided access to the data they collected on each learning activity a student engaged in, as well as the timestamp, the length of the learning activity, the number of questions that a student answered within a lesson or a challenge, and the success rate within a lesson or challenge was logged for each student.
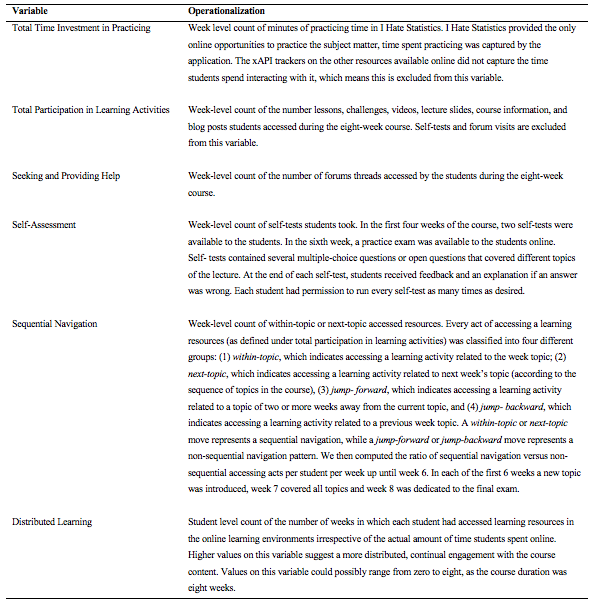
After processing the data, variables were selected to be included in the current study, following the work of Guerra and colleagues (2016), Kim and colleagues (2018), and Theobold and colleagues (2018), These variables are described in Table 1. The count- and time- based variables were aggregated to the week level based on the week-based structure of the course; Each week was structured around a particular topic. The variables Sequential Navigation and Distributed Learning provide a metric (respectively a ratio and a count measure) on student level, in order to deduce an overall measure of students’ patterns in use of the online learning environment throughout the eight weeks of the course.
Table 1
Interpretation of Online Trace Data in Week- and Student Level Variables
4.3.3 Academic performance
Students’ academic performance is measured with the summative course evaluation. At the end of the course students’ final grade was determined based on the results of a multiple-choice exam and the grading of the research report. The exam included 30 four-answer choice questions; ten questions targeted knowledge, ten targeted insight, and the other ten targeted calculations. Appendix B provides sample questions of each category. The exam was designed by the course coordinator. In general, all course coordinators are equipped with a training that covers basic knowledge and skills on constructing multiple choice tests. The course coordinator had, furthermore, access to a data base with high-quality questions used in previous years, which – albeit slightly modified – could be used to put together the exam. The exam underwent peer review and psychometric tests, the latter was used in the grading process. Final grades were scored on a scale from 1 to 10 with 10 being the highest and with 5.5 as passing threshold.
Students were provided with an informed consent form for both the self-report data and the online trace data. In the 2016 cohort, informed consent for the online trace data was obtained at the beginning of the course, whereas informed consent for the self-report data was obtained during the student survey in week 4 of the course. In the 2017 cohort, students were provided with one informed consent form including permission to use both sources of data at the beginning of the course.
Data preparation procedures were applied prior to the analysis. Homogeneity of the data across cohorts was established for motivation and strategy use reported by students, for the variables based on the online trace data, and for academic performance, using Levene’s test for homogeneity of variance and independent-sample t-tests. Multiple imputation methods were applied to deal with missing data on items of the MSLQ scales in the following analyses, using the Markov chain Monte Carlo method with a number of 10 iterations, with IBM SPSS Statistics 25.
To answer the first research question, the extent to which student self-reports tap motivation and strategy use as reflected in the online trace data online learning behaviour was examined. To that end, explained variance in online trace data of learning behaviour by student self-reports was investigated with ordinary least square regression analyses. Total participation in learning activities was used as dependent variable, because it identified between-student and between-week variance and comprised student engagement in both the learning management system and the online practicing environment. After looking at the data on the course level, models were tested on a week level, in order to gauge variability in the relation between online trace data and self-reported data based on the MSLQ and answer the second research question.
To answer the third research question, the relation between self-reports and online trace data was gauged with a third proxy of student motivation and strategy use: student academic performance based on students’ grade on the multiple-choice exam at the end of the course. The proportion explained variance in academic performance by online trace data and self-reports was identified with ordinary least square analyses, separately and combined. In all analyses, students’ gender and age were included as control variables.
In total, 605 students gave active consent to include their data collected during the course for these students could be used in the analyses. The results of the homogeneity tests and descriptive statistics are shown in Table 2. Both the self-reports and the online trace data differ significantly between the cohorts, likely related to the introduction of the practice exam for the 2017 cohort and the demographical shift based on the inclusion of international students in 2017. For example, the level of extrinsic motivation is significantly higher in the second cohort, as well as the average number of self-assessments per student per week. Even though students in the 2017 cohort engaged significantly more in self-assessments, their participation in online learning activities was on average significantly lower and they engaged in online learning activities in six out of eight weeks versus seven in 2016.
Table 2
Tests of Homogeneity
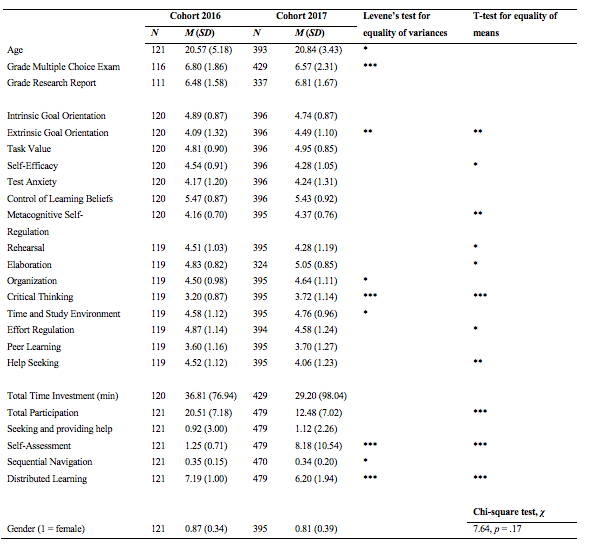
* α =.05; ** α =.01; *** α =.001
The variables obtained through self-reports were regressed on online trace-data, both on student- and week-level, using standardized values, revealing how stable relationship between self-reports and online trace data is over time. Student controls (age, gender, and cohort) were included in each of the models. The results are presented in Table 3. A comparison of the adjusted R2 of the baseline model and the model of the sum of participation over the whole course reveals that students’ self-reports on motivation and strategy use explain about 9% of variance in the resources accessed in the online learning environment.
The adjusted R2 of the models across weeks indicate that students’ self-reports seem to explain more variance in participation in the weeks prior to the collection of the self-reports (week 4) than participation in the weeks afterwards. The self-reports on time and study environment management explain a substantial proportion in variance in participation up and including week 4, but this changes in the weeks after the self-reports were collected. Self-reports on rehearsal and elaboration strategies emerge as significant predictors of participation in week 3-6 and week 8.
Figure 1 shows the extent to which predictions of participation based on the online trace data of week 4 and the self-reports are representative for participation in other weeks. Actual participation levels reveal that student participation fluctuates over time, with on average a peak in week 2 and week 8.
Table 3
Self-Reports Regressed on Online Trace Data
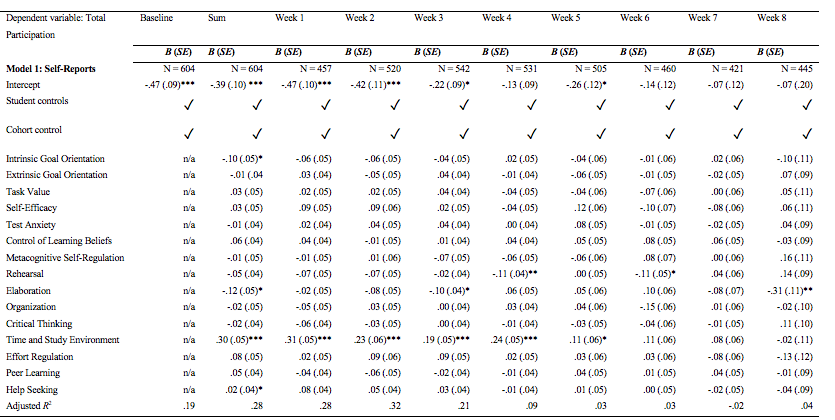
* α =.05; ** α =.01; *** α =.001
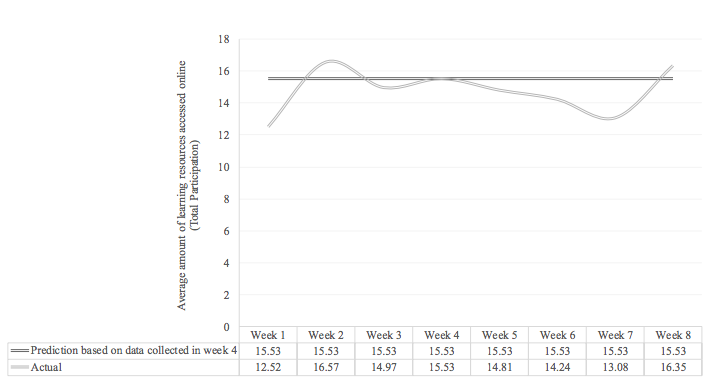
Figure 1. Predicted participation based on the
regression of students’ self-reports on total participation in
week 4 and the actual participation across weeks
The variables based on self-reports and online trace data were regressed on academic performance; using standardized values and in a stepwise fashion, see Table 4. Student controls (age, gender, and cohort) were included in each of the models. The differences in explained variance between Model 1 and Model 2 need to be interpreted with caution, as there are substantially fewer variables included in Model 2. Based on the explained variance of Model 3, it can be concluded that there is a substantial unique contribution of the self-report and online trace data-based variables in predicting academic performance. In the final model, there are three scales of the MSLQ that explain a substantial proportion in academic performance; self-efficacy, elaboration strategies, and effort regulation. Four variables based on the online trace data explain substantial variation; total time invested, total participation, self-assessment and distributed learning. The total time invested in the online learning environment is negative related to academic performance, even though the total amount of resources accessed by the student (i.e. total participation) is positively related to academic performance.
Table 4
Self-Reports and Online Trace Data Regressed on Academic Performance
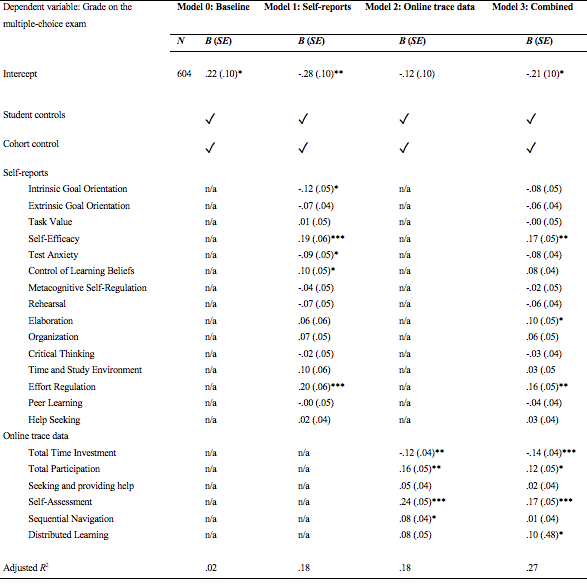
* α =.05; ** α =.01; *** α =.001
Starting from the central questions of this special issue, this study aimed to provide insight in the ways in which self-reports reflect the conceptualizations of the constructs suggested in theory related to motivation or strategy use. To that end, this study looked into the relationship between measures of SRL through aptitude-based self-reports and event-based online trace data. Using event-based measurement methods of SRL based on online trace data complementary to self-report instruments can be a first step in capturing self-regulation as a function of the individual’s dynamic interaction with the learning environment (Boekaerts et al., 2000; Efklides, 2011; Veenman, 2011; Winne & Perry 2000). Capturing the individual’s dynamic interaction with the learning environment can be instrumental in guiding innovations in education towards effective personalized learning and enabling educators to adapt to individual differences in SRL during a study episode or educational program.
The results of this study show that self-reports on motivation and strategy use explain 28% of variance in online study behaviour overall versus 18% in academic performance. None of the MSLQ scales on motivation significantly predicted online learning behaviour, whereas several MSLQ scales on strategy use did; namely the scales that measured rehearsal strategies, elaboration strategies, and time and study environment management strategies. Given the prominent role of personal goals, efficacy, and interest in general models for student learning (Fryer, 2017), it is striking that the MSLQ scales on motivation did not explain variance in online trace data. At the same time, these results are in line with previous research on self-reports of motivation in higher education that does show a strong relation with achievement (e.g. Hattie, 2015) but not with study behaviour measured with online trace data (e.g. Cho & Heron, 2015; Zhou & Winne, 2012). This could suggest that the motivational aspects of self-regulatory processes are not captured with online trace data, because of their covert nature. In that respect, it is of importance to recognize the crucial role of self-reports in gaining broad insights in SRL.
At the same time, the results of this study underline the added value of online trace data of learning behaviour. Firstly, online trace data of learning behaviour explained a unique proportion of variance in student academic performance. In this study, the number of logins, number of operations performed on discussion forums and resources accounted for approximately 18% of the variance in academic performance. Although this is substantially less than the 21% found by Gašević and colleagues (2014), it is equal to the amount of variance in academic performance explained by students’ self-reports on motivation and strategy use. As expected and along with the findings of the study of Cho & Yoo (2017), where online trace data produced an even more precise prediction of academic performance than students’ self-reports, this study provides a strong indication of the potential of online trace data to tap self-regulatory processes, in particular strategy use. The fact that online trace data still predict a unique proportion of variance in academic performance when studied in combination with self-reports might be explained by its potential to bypass a potential upward bias in self-reports of motivation and strategy use due to the overconfidence effect (Taylor & Brown, 1988) as they do not suffer from socially desirable responding bias.
Finally, this study shows that online study behaviour and the relation between self-reports and online trace data varies vastly from week to week. Students’ self-reports seem to be mainly based on prior learning experiences within the course, as the reports did explain variation in online learning behaviour prior to the collection of self-reports, but substantially less thereafter. This finding is in line with the expectations around the second research question and fits the theoretical lens provided by Fryer (2017) about the feedback loop between students and their learning experiences. In light of the second central questions of the special issue addressed in this study, we can conclude that the use of self-reports does constrain the analytical choices made with self-report data to some extent: The online trace data revealed large amount of within student variance. Online trace data are therefore an important addition to self-reports in guiding innovations in education towards effective instructional design and personalized learning as they have the potential to give teachers and students real-time insights in strategy use and self-regulation.
An avenue for future research is to combine event-based self-reports and online trace data in measuring SRL. Especially since the results of this study did not identify a relation between online trace data and self-motivational beliefs, potentially due to the weak reliability of some of the MSLQ scales. Furthermore, the identified heterogeneity of the two cohorts in this study warrants further investigation. It is possible that the consent procedure in the first cohort did not yield a representative sample of the students in the first cohort with respect to their propensity to engage in self-regulated learning within the specific context of this course.
Future research is also needed to investigate how real-time measures of SRL through online trace data and self-reports can inform teaching and learning. The LISSA project is a good example where learning analytics were used to support the adviser-student dialogue, in a way that helped motivate students, triggered conversation, and provided tools to add personalization, depth, and nuance to the advising session (Charleer et al., 2018). Similar efforts based on online trace data or event-based self-reports are scarce, but pivotal to design and evaluate personalized interventions in online learning environments that promote effective study behaviour.
Funding: This work is part of the project ‘SURFnet Learning Analytics Hoger Onderwijs’, supported by the National Control Unit Educational research (NRO) (project-id 405-17-851).
Bera, S., & Liu, M. (2006). Cognitive tools, individual
differences, and group processing as mediating factors in a
hypermedia environment. Computers in Human Behavior, 22,
295-319. http://doi.org/10.1016/j.chb.2004.05.001
Boekaerts, M., & Corno, L. (2005). Self‐regulation in the
classroom: A perspective on assessment and intervention. Applied
Psychology, 54, 199-231.
http://doi.org/10.1016/j.chb.2004.05.001
Boekaerts, M., Pintrich, P. R., & Zeidner, M. (2000).
Self-regulation: An introductory overview. In Handbook of
self-regulation (pp. 1-9). Academic Press.
Charleer, S., Moere, A. V., Klerkx, J., Verbert, K., & De
Laet, T. (2017). Learning analytics dashboards to support
adviser-student dialogue. IEEE Transactions on Learning
Technologies, 11, 389-399.
http://doi.org/10.1109/TLT.2017.2720670
Cho, M. H., & Heron, M. L. (2015). Self-regulated learning:
the role of motivation, emotion, and use of learning strategies in
students’ learning experiences in a self-paced online mathematics
course. Distance Education, 36, 80-99.
http://doi.org/10.1080/01587919.2015.1019963
Cho, M. H., & Yoo, J. S. (2017). Exploring online students’
self-regulated learning with self-reported surveys and log files:
a data mining approach. Interactive Learning Environments,
25, 970-982. http://doi.org/10.1080/10494820.2016.1232278
Coogan, J., Dancey, C. P., & Attree, E. A. (2005). WebCT: a
useful support tool for psychology undergraduates–a Q
methodological study. Psychology Learning and Teaching,
5, 61-66. http://doi.org/10.2304/plat.2005.5.1.61
Cornelisz, I., & Van Klaveren, C. (2018). Student engagement
with computerized practising: Ability, task value, and difficulty
perceptions. Journal of Computer Assisted Learning, 34(6),
828-842. http://doi.org/10.1111/jcal.12292
DeNeui, D. L., & Dodge, T. L. (2006). Asynchronous learning
networks and student outcomes: The utility of online learning
components in hybrid courses. Journal of Instructional
Psychology, 33, 256-260.
Dinsmore, D. L., Alexander, P. A., & Loughlin, S. M. (2008).
Focusing the conceptual lens on metacognition, self-regulation,
and self-regulated learning. Educational Psychology Review,
20, 391-409. http://doi.org/10.1007/s10648-008-9083-6
Greller, W. & Drachsler, H. (2012). Translating Learning into
Numbers: A Generic Framework for Learning Analytics. Journal
of Educational Technology & Society, 15,
42-57. Retrieved from
http://www.jstor.org/stable/jeductechsoci.15.3.42
Chauliac, M., Catrysse, L., Gijbels, D., & Donche,
V. (2020). It is all in the surv-eye: Can eye tracking data shed
light on the internal consistency in self-report questionnaires on
cognitive processing strategies? Frontline Learning Research,
8(3), 26–39. http://doi.org/10.14786/flr.v8i3.489
Duncan, T. G., & McKeachie, W. J. (2005). The making of the
motivated strategies for learning questionnaire. Educational
psychologist, 40, 117-128.
http://doi.org/10.1207/s15326985ep4002_6
Efklides, A. (2011). Interactions of metacognition with motivation
and affect in self-regulated learning: The MASRL model. Educational
Psychologist, 46, 6-25.
http://doi.org/10.1080/00461520.2011.538645
Ellis, R. A., Marcus, G., & Taylor, R. (2005). Learning
through inquiry: student difficulties with online course‐based
Material. Journal of Computer Assisted Learning, 21, 239-252.
http://doi.org/10.1111/j.1365-2729.2005.00131.x.
Entwistle, N., & McCune, V. (2004). The conceptual bases of
study strategy inventories. Educational Psychology Review,
16, 325-345. http://doi.org/10.1007/s10648-004-0003-0
Fryer, L. K. (2017). Building bridges: Seeking structure and
direction for higher education motivated learning strategy models.
Educational Psychology Review, 29, 325-344.
http://doi.org/10.1007/s10648-017-9405-7
Gašević, D., Dawson, S., Rogers, T., & Gašević, D. (2016).
Learning analytics should not promote one size fits all: The
effects of instructional conditions in predicting academic
success. The Internet and Higher Education, 28,
68-84. http://doi.org/10.1016/j.iheduc.2015.10.002.
Gašević, D., Kovanovic, V., Joksimovic, S., & Siemens, G.
(2014). Where is research on massive open online courses headed? A
data analysis of the MOOC Research Initiative. The
International Review of Research in Open and Distributed
Learning , 15, 134-176.
http://doi.org/10.19173/irrodl.v15i5.1954.
Guerra, J., Hosseini, R., Somyurek, S., & Brusilovsky, P.
(2016). An intelligent interface for learning content: Combining
an open learner model and social comparison to support
self-regulated learning and engagement. In Proceedings of
the 21st international conference on intelligent user interfaces
(pp. 152-163). ACM.
Hadwin, A. F., Nesbit, J. C., Jamieson-Noel, D., Code, J., &
Winne, P. H. (2007). Examining trace data to explore
self-regulated learning. Metacognition and Learning, 2(2-3),
107-124. http://doi.org/10.1007/s11409-007-9016-7
Han, J., Pei, J., & Kamber, M. (2011). Data mining:
concepts and techniques. Elsevier.
Heffner, M., & Cohen, S. H. (2005). Evaluating student use of
web-based course material. Journal of Instructional
Psychology, 32, 74-82.
Hilpert, J. C., Stempien, J., van der Hoeven Kraft, K. J., &
Husman, J. (2013). Evidence for the latent factor structure of the
MSLQ: A new conceptualization of an established questionnaire. SAGE
Open, 3, 2158244013510305.
Hoskins, S. L., & Van Hooff, J. C. (2005). Motivation and
ability: which students use online learning and what influence
does it have on their achievement? British Journal of
Educational Technology, 36, 177-192.
http://doi.org/10.1111/j.1467-8535.2005.00451.x.
Howard-Rose, D., & Winne, P. H. (1993). Measuring component
and sets of cognitive processes in self-regulated learning. Journal
of Educational Psychology, 85, 591.
http://doi.org/10.1111/j.1464-0597.2005.00205.x
Huon, G., Spehar, B., Adam, P., & Rifkin, W. (2007). Resource
use and academic performance among first year psychology students.
Higher Education, 53, 1-27.
http://doi.org/10.1007/s10734-005-1727-6
Iaconelli, R., & Wolters, C. A. (2020). Insufficient effort
responding in surveys assessing self-regulated learning: Nuisance
or fatal flaw?Frontline Learning Research, 8(3),
105–127. http://doi.org/10.14786/flr.v8i3.521
Itmazi, J. A., & Megías, M. G. (2005). Survey: Comparison and
evaluation studies of learning content management systems. Unpublished
manuscript.
Jamieson-Noel, D., & Winne, P. H. (2003). Comparing
Self-Reports to Traces of Studying Behavior as Representations of
Students' Studying and Achievement. Zeitschrift für
Pädagogische Psychologie/German Journal of Educational
Psychology. http://doi.org/10.1024//1010-0652.17.34.159
Jivet, I., Scheffel, M., Drachsler, H., & Specht, M. (2017).
Awareness is not enough. Pitfalls of learning analytics dashboards
in the educational practice. In É. L., H. D., K. V., J. B., &
M. P-S. (Eds.), Data Driven Approaches in Digital Education:
12th European Conference on Technology Enhanced Learning, EC-TEL
2017, Tallinn, Estonia, September 12–15, 2017, Proceedings
(Lecture Notes in Computer Science (LNCS); Vol. 10474). Cham:
Springer International Publishing AG.
http://doi.org/10.1007/978-3-319-66610-5_7
Jivet, I., Scheffel, M., Specht, M., & Drachsler, H. (2018).
License to evaluate: preparing learning analytics dashboards for
educational practice. In Proceedings of the 8th
International Conference on Learning Analytics and Knowledge
(pp. 31-40). ACM. http://doi.org/10.1145/3170358.3170421
Jiang, L., Elen, J., & Clarebout, G. (2009). The relationships
between learner variables, tool-usage behaviour and performance. Computers
in Human Behavior, 25, 501-509.
http://doi.org/10.1016/j.chb.2008.12.010
Jupp, V. (2006). The Sage dictionary of social research
methods. Sage.
Kim, D., Yoon, M., Jo, I. H., & Branch, R. M. (2018). Learning
analytics to support self-regulated learning in asynchronous
online courses: A case study at a women's university in South
Korea. Computers & Education, 127,
233-251. http://doi.org/10.1016/j.compedu.2018.08.023.
Knight, J. (2010). Distinguishing the learning approaches adopted
by undergraduates in their use of online resources. Active
Learning in Higher Education, 11, 67–76.
http://doi.org/10.1177/1469787409355873
Lust, G., Collazo, N. A. J., Elen, J., & Clarebout, G. (2012).
Content management systems: enriched learning opportunities for
all? Computers in Human Behavior, 28, 795-808.
http://doi.org/10.1016/j.chb.2011.12.009
Lust, G., Elen, J., & Clarebout, G. (2013). Regulation of
tool-use within a blended course: Student differences and
performance effects. Computers & Education, 60,
385-395. http://doi.org/10.1016/j.compedu.2012.09.001
McKeachie, W. J., Pintrich, P. R., & Lin, Y. G. (1985).
Teaching learning strategies. Educational Psychologist, 20, 153-160.
http://doi.org/10.1207/s15326985ep2003_5
Molenda, M. (2008). Historical foundations. In M. J. Spector, M.
D. Merrill, J. van Merrienboer, & M. P. Driscoll (Eds.).
Handbook of research for educational communications and
technology (pp. 5–20). Routledge.
Moeller, J., Dietrich, J., Viljaranta, J., & Kracke, B.
(2020). Disentangling objective characteristics of learning
situations from subjective perceptions thereof, using an
experience sampling method design. Frontline Learning
Research, 8(3), 63–85.
http://doi.org/10.14786/flr.v8i3.529
Muis, K. R., Winne, P. H., & Jamieson-Noel, D. (2007). Using a
multitrait-multimethod analysis to examine conceptual similarities
of three self-regulated learning inventories. British Journal
of Educational Psychology, 77, 177–195.
http://doi.org/10.1348/000709905X90876
Munoz, KD, & Van Duzer, J. (2005). BlackBoard vs.
Moodle: A Comparison of Satisfaction with Online Teaching and
Learning Tools. Humboldt State University.
Panadero, E. (2017). A review of self-regulated learning: six
models and four directions for research. Frontiers in
Psychology, 8, 422.
http://doi.org/10.3389/fpsyg.2017.00422
Panadero, E., Klug, J., & Järvelä, S. (2016). Third wave of
measurement in the self-regulated learning field: when measurement
and intervention come hand in hand. Scandinavian Journal of
Educational Research, 60, 723-735.
http://doi.org/10.1080/00313831.2015.1066436
Pintrich, P. R. (1991). A manual for the use of the Motivated
Strategies for Learning Questionnaire (MSLQ).
Pintrich, P. R. (2000). Multiple goals, multiple pathways: The
role of goal orientation in learning and achievement. Journal
of Educational Psychology, 92, 544.
http://doi.org/10.1037/0022-0663.92.3.544
Pintrich, P. R., McKeachie, W. J., & Lin, Y. G. (1987).
Teaching a course in learning to learn. Teaching of
Psychology, 14, 81-86.
http://doi.org/10.1207/s15328023top1402_3
Rogiers, A.; Merchie, E., & van Keer, H. (2020). Opening the
black box of students’ text-learning processes: A process mining
perspective. Frontline Learning Research, 8(3),
40–62. http://doi.org/10.14786/flr.v8i3.527
Schmitz, M., Scheffel, M., van Limbeek, E., van Halem, N.,
Cornelisz, I., van Klaveren, C., ... & Drachsler, H. (2018).
Investigating the Relationships Between Online Activity, Learning
Strategies and Grades to Create Learning Analytics-Supported
Learning Designs. In European Conference on Technology
Enhanced Learning (pp. 311-325). Springer, Cham.
Taylor, S. E. & Brown, J. D. (1988). Illusion and well-being:
A social psychological perspective on mental health. Psychological
Bulletin , 103, 193–210.
http://doi.org/10.1037/0033-2909.103.
Tock, J. L., & Moxley, J. H. (2017). A comprehensive
reanalysis of the metacognitive self-regulation scale from the
MSLQ. Metacognition and Learning, 12, 79-111.
http://doi.org/10.1007/s11409-016-9161-y
Veenman, M. (2011). Learning to self-monitor and self-regulate. In
R. Mayer & P. Alexander (Eds.), Handbook of research on
learning and instruction (pp. 197–218). New York:
Routledge.
Vriesema, C. C., & McCaslin, M. (2020) Experience and meaning
in small-group contexts: Fusing observational and self-report data
to capture self and other dynamics. Frontline Learning
Research, 8 (3), 128–141.
http://doi.org/10.14786/flr.v8i3.493
Wang, A. Y., & Newlin, M. H. (2000). Characteristics of
students who enroll and succeed in psychology web-based classes. Journal
of Educational Psychology, 92, 137.
http://doi.org/10.1037/0022-0663.92.1.137.
Winne, P. H., & Baker, R. S. (2013). The potentials of
educational data mining for researching metacognition, motivation
and self-regulated learning. Journal of Educational Data
Mining, 5, 1-8. Retrieved from
https://jedm.educationaldatamining.org/index.php/JEDM/article/view/28
Winne, P. H., & Perry, N. E. (2000). Measuring self-regulated
learning. In M. Boekaerts, P. R. Pintrich, & M. Zeidner
(Eds.), Handbook of self-regulation. Academic Press.
Zhou, M., & Winne, P. H. (2012). Modelling academic
performance by self-reported versus traced goal orientation. Learning
and Instruction, 22, 413-419.
http://doi.org//j.learninstruc.2012.03.004
Zimmerman, B. J. (2008). Investigating self-regulation and
motivation: Historical background, methodological developments,
and future prospects. American Educational Research Journal,
45,
166–183. http://doi.org/10.3102/0002831207312909

Example questions from the 2016-2017 exam
An example of a knowledge question:*
Fill in the blanks: The ….I…. test is used for testing the
difference in proportions between dependent samples and the ….II….
test for testing the difference in proportions between small
independent samples.
a. I: Binomial, II: Chi-squared
b. I: Chi-squared, II: binomial
c. I: McNemar, II: Fisher’s exact
d. I: Fisher’s exact, II: McNemar
An example of an insight question:
In order to evaluate differences in study success across
different programs offered at the VU, an equal number of students
are randomly selected from each program and asked to participate
in the research. This is an example of:
a. Systematic random sampling
b. Cluster sampling
c. Stratified random sampling
d. Multi-stage sampling
An example of a calculation question:
Research results have revealed that intelligence in the
Netherlands is normally distributed. The mean IQ score is 100 with
a standard deviation of 15. John has an IQ-score of 122.5. What
percentage of people in the Netherlands will have an IQ lower than
that of John?
a. 3.34 %
b. 6.68 %
c. 93.32 %
d. 96.66 %
*The correct answer is provided in bold.