![]()
Frontline Learning Research Vol.7 No. 4 (2019) 58
- 65
ISSN 2295-3159
aLudwig-Maximilians-Universität
München, Germany
Article received 28 March 2019/ revised 15 May / accepted 10 October/ available online 3 December
The ability to correctly interpret data is an important skill in modern knowledge societies. The present study investigates adults’ ability to interpret covariation data presented in bar graphs. Drawing on previous findings that show that the problem context influences the interpretation of contingency tables (grounded and concrete problems are easier than abstract ones) and based on findings from the literature on motivated reasoning (confirming problems are easier than disconfirming ones), we present N = 111 undergraduates with bar graphs in either grounded (confirming or disconfirming) or abstract contexts. Our results show that only grounded problems in confirming contexts are easier than abstract ones; grounded problems in disconfirming contexts are more challenging than abstract ones. Overall, the interpretation of bar graphs is difficult: Even in our sample of educated college students, correct performance did not exceed 50%. Our results support earlier findings regarding the context dependency of data-interpretation skills, and they suggest that relatively minor task variations have an impact on reasoners’ interpretations of bar graphs.
Keywords: data interpretation; bar graphs; problem context; confirming; disconfirming
Data interpretation is a key feature of scientific thinking, and it is an important skill—not only in schools, but also in everyday life, where people need to consider complex data when making far-reaching decisions (e.g., when making decisions in the context of elections, investments, or about medical treatments). Although basic abilities in data interpretation are already present in elementary school children (Koerber, Mayer, Osterhaus, Schwippert, & Sodian, 2015), even adults have difficulties to correctly interpret complex data about covariation (e.g., Saffran, Barchfeld, Sodian, & Alibali, 2016). For instance, when asked to interpret data presented in 2x2 contingency tables, reasoners frequently fail to use the correct strategy, which involves a comparison of the conditional probabilities across the rows. Often, reasoners use simpler strategies: they compare the absolute frequencies across two cells (compare-two strategy; Shaklee & Tucker, 1980) or they try to find an anchor in the data (a simple ratio between two cells, such as 1:1 or 2:1) to which they compare the ratio between the other two cells (anchor-and-compare strategy; Osterhaus, Magee, Saffran, & Alibali, 2019).
Previous work has shown that reasoners’ successful interpretations of contingency tables depend on two characteristics of the task, which are the symmetry of the problem (symmetric vs. asymmetric; Saffran et al., 2016) and the problem context (grounded vs. abstract; Osterhaus et al., 2019). Symmetric problems involve a comparison between two candidate causes (i.e., X1 leads to Y, X2 leads to Y), whereas in asymmetric problems, a candidate cause is compared to a control group, to which no intervention is applied (X leads to Y, not-X leads to Y). Symmetric problems are easier, because they seem to equally draw reasoners’ attention to all four cells. Comparing grounded to abstract contingency problems, research has shown that grounded problems (i.e., problems involving a concrete context and cover story) are easier, because they seem to afford a quicker access to long-term memory and the easier access of pragmatic cognitive schemas that might support reasoning (Osterhaus et al., 2019).
Contingency tables are an effective way to present data regarding the relation between two dichotomous variables. They are, however, not the most common form of data presentation that people encounter in their daily lives. More frequent are visualizations, such as bar graphs, which people are presented with far more often, for instance in the media. Bar graphs facilitate information processing by presenting covariation data in a spatial organization that allows reasoners to quickly grasp the relation between two variables, and also, they allow to outsource cognitive processes to an additional perceptual route (Hegarty, 2011).
Research shows that already young kindergarten and elementary school children can read off information about relations from graphs, resulting in an update of existing beliefs in response to the data (Koerber, Osterhaus, & Sodian, 2017). Although bar graphs are a common and effective way of presenting data, adults’ ability to interpret this form of data presentation is not well understood, and it is unclear if task variations (like the ones observed in the study of contingency tables) have a similar impact on people’s interpretation and strategy choice on these problems.
The present study, therefore, investigates adults’ ability to interpret data that is presented in bar graphs. Following earlier findings regarding the influence of context on the interpretation of contingency tables (Osterhaus et al., 2018), we present participants with bar graphs that are embedded in either a grounded or abstract context, and that can only be solved correctly by using the conditional-probabilities strategy (comparing conditional probabilities across conditions).
Based on prior findings from the study of contingency tables (Osterhaus et al., 2019), we hypothesized that grounded problems afford correct interpretations relative to abstract ones. Drawing on the literature on reasoning biases in data interpretation (Chinn & Brewer, 1993) and on motivated reasoning (Klaczynski, 2001), our study also explores if the beneficial effect of grounded problems is stable across confirming and disconfirming contexts. It is reasonable to assume that grounded problems are only easier when they are confirming, that is, when they lead to an activation of prior knowledge that is in line with the data presented. Research has shown that people are less likely to take seriously an implausible covariation between two factors when there is no plausible causal explanation (Koslowski, 1996), and so we expect disconfirming contexts to be, in turn, more difficult. Disconfirming contexts present reasoners with causal relations that seem implausible given their prior knowledge, which may result in a distortion, rather than an affordance, of their correct interpretation.
The sample comprised 111 university students who were (in majority) recruited from two large German research universities (N = 111; 91 females, 19 males; 1 participant did not disclose their gender). Informed consent was obtained from all participants. Participants were recruited via social media and through advertising in the universities. Participants received either course credit for their participation or they entered a lottery to win a voucher for a bookstore.
We used a within-subjects design with three groups (confirming vs. disconfirming vs. abstract context) in which participants interpreted a set of 3 x 3 (9) bar graphs. A post-hoc power analysis conducted with G*Power (Faul, Erdfelder, Lang, & Buchner, 2007) showed a power of 1-β = 1.00 (α = 0.05, effect size f = 0.71).
We used three different bar graphs for each of the three conditions (confirming vs. disconfirming vs. abstract contexts). All problems were presented in the asymmetric form to provide the highest difficulty level. The frequencies displayed in the bar graphs were taken from a prior study with contingency tables (Saffran et al., 2016; see Table 1). We only included cell frequencies that resulted in problems that could exclusively be solved by using the conditional-probabilities strategy (but not any other less sophisticated strategy). This way, participants’ correct solutions are indicative of their use of the conditional-probabilities strategy, which is the only strategy that guarantees the correct interpretation independently of the exact cell frequencies. The problems should, therefore, be of comparable difficulty—especially because we chose cell frequencies < 1,000 in order to keep computing demands at an acceptable level.
The bar graphs were designed in Microsoft® Excel (for an example, see Figure 1) and they were presented in an online questionnaire. For every bar graph, participants were asked to decide (based on the data presented) if a given intervention (present, absent) has a positive, negative, or no effect at all on a given dichotomous outcome variable (effect present, absent). For the confirming problems, participants interpreted data that showed a positive relation between tutoring (in maths, physics, or chemistry) and grade improvement (i.e., the number of students whose grades did or did not improve); for the disconfirming problems, participants interpreted data that showed a negative or no relation between doing sports (jogging, cycling, or swimming) and the improvement of people’s fitness level (i.e., the number of people whose fitness level did or did not improve); and for the abstract problems, participants interpreted data that showed a positive, negative or no effect between an abstract candidate cause (X, Y, or Z) and an abstract outcome variable x (i.e., the number of instances where x is present or absent). The specific problem contexts in the grounded condition were chosen because we expected them to elicit equally strong expectations regarding the direction of the causal relation (e.g., tutoring improves grades, doing sports improves fitness level).
Table 1
Overview of Frequencies Used in the Problems and Correct Solutions per Problem
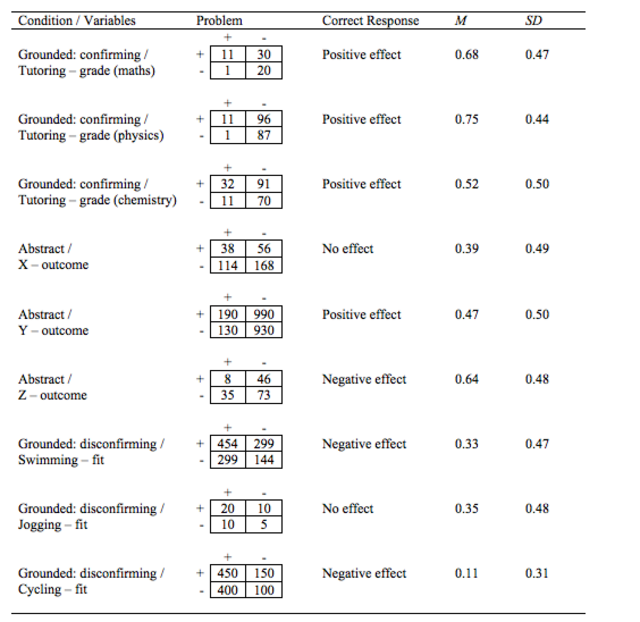
Note. The contingency tables under ‘Problem’ display the treatment condition in the columns (treatment +/ no treatment -) and the outcome in the rows (improvement +/ no improvement -).
Participants responded to the nine items in an online questionnaire (Social Science Survey). Confirming, disconfirming, and abstract problems were presented in a randomized order; this order was the same for all participants. There were no minimum or maximum time boundaries for inclusion in the study (only three participants took longer than one hour to click through the problems). For the remaining participants, the completion of the survey took on average 6.5 minutes (SD = 7.1).
Participants were given 1 point per problem when they offered the correct interpretation of the data, and 0 points when they did not. A sum score was calculated, so that participants could obtain between 0 and 3 points for each of the three conditions. The correct response for each item was determined by comparing the conditional probabilities regardless of the size of the difference. If the two conditional probabilities for ‘improved’ were equal and P (improved | Treatment) = P (improved | No Treatment), there was no effect. If P (improved | Treatment) > P (improved | No Treatment), there was a positive effect; if P (improved | Treatment) < P (improved | No Treatment), there was a ‘negative effect’.
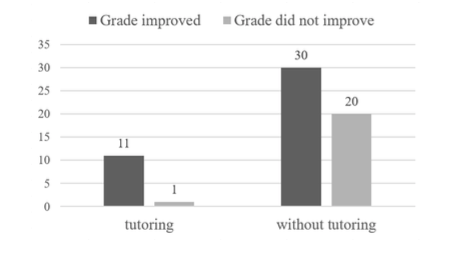
Figure 1. Example item (grounded, confirming context).
On average and across all conditions, participants provided correct solutions on 4.23 of the 9 problems (SD = 2.48, min = 0, max = 9). Performance differed substantially across items, ranging from 11% to 68% correct (see Table 1).
A repeated-measures analysis of variance (ANOVA) was conducted to test for the influence of context. The assumption of sphericity was met (Mauchly’s W = 0.951, p = 0.06). The data were not distributed normally, but the repeated-measures ANOVA tends to be robust against violations of the assumption of normality. The analysis revealed significant differences between the three conditions, F(2, 222) = 73.66, p < .001, η2 = 0.40. A planned contrast (problem context) indicated no significant difference between the grounded (confirming and disconfirming) and abstract problems, t(110) = -1.718, p = .96. A set of post-hoc tests, however, revealed significant differences between all three conditions: the confirming condition (M = 1.9, SD = 1.1) was significantly easier than the abstract condition (M = 1.5, SD = 0.9), t(110) = 5.11, p < .001, Cohen’s d = .48, which in turn was significantly easier than the disconfirming condition (M = 0.8, SD = 1.0), t(110) = 7.59, p < .001, Cohen’s d = .72 (see Figure 2).

Figure 2. The average amount of correct solutions (out of a maximum of 3) per condition (confirming vs. abstract vs. disconfirming contexts). Error bars display standard errors (SE).
Bar graphs are a commonly-used visualization to present data about covariation. Despite their common use, the findings of the present study show that they are difficult to be correctly interpreted, even by educated undergraduate students. This is especially true when the data are presented in abstract or disconfirming contexts.
The influences of problem context (grounded vs. abstract) have not previously been investigated in reasoners’ interpretation of bar graphs. Findings from the study of people’s interpretation of contingency tables suggest that grounded problems are easier than abstract ones because they may support reasoning by enabling a quicker access to long-term memory and the easier access of pragmatic cognitive schemas. The present study shows that indeed grounded problems lead to a higher number of correct responses. Extending on previous work, our results, however, show that this finding only holds when a confirming context is used (i.e., a context that presents participants with a causal relation that is plausible given their prior knowledge). When, in turn, a disconfirming context is used (i.e., a context that presents participants with a causal relation that is implausible given their prior knowledge), correct performance declines.
The decline in performance for disconfirming contexts is in line with the literature on reasoning biases in scientific reasoning (Chinn & Brewer, 1993) and motivated reasoning (Klaczynski, 2000), and it suggests that participants are guided by their prior knowledge when solving problems like the ones presented in the current study. On all disconfirming problems, the use of a simple strategy (e.g., compare two) resulted in an interpretation that seemed plausible given participants’ prior knowledge. On the confirming problems, the use of the same simple strategy resulted in an interpretation that seemed implausible. It seems likely that participants generally used less sophisticated strategies first and did not invest further cognitive resources if their judgement was in line with their expectations based on prior knowledge. When, however, an initially not sophisticated interpretation resulted in an implausible, conflicting outcome, participants were likely inclined to pay more attention to the data and to explore various interpretations. Compared to abstract contexts, the use of grounded problems thus has a general impact on performance. Whether or not this influence is beneficial or detrimental, however, depends on the specific context that is used and its fit with participants’ prior knowledge.
Correct performance was, in the present study, overall low: the undergraduate students in our sample solved only an average of 47% of the problems correctly. This percentage is higher than the chance of correct guessing and it is similar to undergraduate students’ interpretation of contingency tables, for which comparable numbers of correct solutions were found (e.g., 54% in Osterhaus et al., 2019). Although correct performance is difficult to compare across studies (in our study, only the conditional probabilities strategy led to correct responses; in other studies, some problems can be solved with simpler strategies), the present findings suggest that the interpretation of bar graphs is, in contrast to popular belief, not substantially easier than the interpretation of data that is presented in contingency tables.
A limitation of the present study is that the conditional probabilities were not equal across conditions. That is, in order to confirm or disconfirm participants’ prior beliefs, we used different causal directions and strengths across conditions. Future work should keep these probabilities constant to assure that they are not confounding factors that may potentially drive the effect. All of the items that we used in the present study, however, could only be solved with the conditional-probabilities strategy. Research has shown that reasoners’ use of this strategy is quite consistent across contingency tables with different conditional probabilities (Osterhaus et al., 2019), and so we do not expect the discrepancies in conditional probabilities to have caused the substantial differences in correct solutions (and strategy use) between the conditions.
The difficulties in interpreting bar graphs that we documented in the present study are a finding that needs to be stressed. People are often presented with bar graphs (e.g., in the media, in patient brochures, in investment information, etc.), and overestimating reasoners’ ability to correctly interpret this information is likely to result in poor decision making. Future research should, therefore, address the question of how to foster this important ability, thereby increasing scientific literacy and helping people to draw correct inferences from diverse forms of data, including bar graphs.
The research was conducted by Nina Knöchelmann, Sabine Krueger, and Anita Flack in the context of a BSc psychology seminar at the Ludwig-Maximilians-Universität München (LMU), under the direction of Christopher Osterhaus. The research was supported by a “teaching through research” grant provided by LMU (Forschungsförderung “Lehre@LMU”), awarded to Matthias Stadler and Christopher Osterhaus. We are grateful to all participants for their friendly collaboration and support of this research.
Chinn, C. A., & Brewer, W. F. (1993). The role of anomalous
data in knowledge acquisition: A theoretical framework and
implications for science instruction. Review of Educational
Research, 63, 1-49. doi:10.3102/00346543063001001
Faul, F., Erdfelder, E., Lang, A.-G., & Buchner, A. (2007).
G*Power 3: A flexible statistical power analysis program for the
social, behavioral, and biomedical sciences. Behavior
Research Methods, 39, 175–191.
doi:10.3758/BRM.41.4.1149
Hegarty, M. (2011). The cognitive science of visual-spatial
displays: implications for design. Topics in Cognitive
Science, 3(3), 446–474.
doi:10.1111/j.1756-8765.2011.01150.x
Klaczynski, P. A. (2000). Motivated scientific reasoning biases,
epistemological beliefs, and theory polarization: a two-process
approach to adolescent cognition. Child Development, 71,
1347–1366. doi:10.1111/1467-8624.00232
Koerber, S., Osterhaus, C., & Sodian, B. (2017). Diagrams
support belief revision. Frontline Learning Research, 5(1),
76–84. doi:10.14786/flr.v5i1.265
Koerber, S., Mayer, D., Osterhaus, C., Schwippert, K., &
Sodian, B. (2015). The development of scientific thinking in
elementary school: A comprehensive inventory. Child
Development, 86, 327–336. doi:10.1111/cdev.12298
Koslowski, B. (1996). Theory and evidence: The development of
scientific reasoning. Cambridge, MA: MIT Press.
Osterhaus, C., Magee, J., Saffran, A., & Alibali, M. W.
(2019). Supporting successful interpretations of covariation data:
Beneficial effects of variable symmetry and problem context. Quarterly
Journal of Experimental Psychology, 72, 994–1004.
doi:10.1177/1747021818775909
Saffran, A., Barchfeld, P., Sodian, B., &
Alibali, M. W. (2016). Children’s and adults’ interpretation of
covariation data: Does symmetry of variables matter? Developmental
Psychology, 52, 1530–1544.
doi:10.1037/dev0000203
Shaklee, H., & Tucker, D. (1980). A rule analysis of judgments
of covariation between events. Memory &
bars display standard errors (SE).