![]()
Frontline Learning Research Vol.7 No. 2 (2019) 1
- 22
ISSN 2295-3159
aUniversity of Teacher Education
St. Gallen, Switzerland
Article received 9 September 2018/ revised 2 November / accepted 5 March/ available online 25 March
Classroom disturbances impair the quality of teaching and learning, and they can be a source of strain for both teachers and students. Some studies indicate, however, that not everyone involved gets equally disturbed by the same occurrences. Altogether, there is still little solid knowledge about the teachers’ and the students’ subjective perception of disturbance. Moreover, rater effects may have confounded the findings available. Addressing these desiderata, the SUGUS study investigates two elements of classroom disturbances within an interactionist framework: the incidence of deviant behaviour shown by particular target students, and the intensity of disturbance as subjectively perceived by teachers, by classmates, and by the targets themselves. For this purpose, we conducted a questionnaire survey among 85 primary-school class teachers and 1412 students. The data were analysed by means of a two-level correlated trait – correlated method minus one [CT-C(M-1)] model. This relatively novel statistical procedure has only rarely been applied in educational research so far. It made it possible to determine the respondents’ common view on classroom disturbances as well as the rater-specific perspectives. The results indicate that increasing deviance coincides with increasing distraction and annoyance – but mainly in a relatively small intersection of the different perspectives. Beyond that, the analysis revealed substantial rater effects which explain 30 to 61% of variance in teacher ratings, for instance. The author discusses likely reasons why disturbances are perceived so divergently.
Keywords: Classroom disturbances; deviant behaviour; subjective perception of disturbance; rater effects; CT-C(M-1) modelling
Classroom disturbances arise from inappropriate student or teacher behaviour (Montuoro & Lewis, 2015), albeit not everyone in class gets equally distracted or annoyed (Eckstein, Grob, & Reusser, 2016). This implies that classroom disturbances consist of an objective core that the persons involved may perceive differently (Eckstein, 2018). This argument is theoretically well-founded, but there is only little empirical evidence regarding commonalities and differences between the teachers’ and the students’ distinct perceptions. This paper presents a new methodological approach to investigating three perspectives on the objective core of classroom disturbances: the self-perception of students, the perception of teachers, and the perception of classmates. Building on two main lines of theory and research, the focus lies on deviant student behaviour and on the persons’ subjective perception of disturbance.
A first line of theory and research on classroom disturbances has focused on student behaviour that deviates from specific classroom rules (e.g. chattering) or from common socio-moral conventions (e.g. insolence). Studies on incidence rates from several countries largely agree that the most frequent forms of deviant student behaviour are relatively minor discipline problems whereas aggressive and dissocial behaviours are considerably rarer (Beaman, Wheldall, & Kemp, 2007; Crawshaw, 2015). Many studies investigated ontogenetically determined risk factors of deviant student behaviour, e.g. impulsivity (Carroll, Houghton, Taylor, West, & List-Kerz, 2006). Other studies examined proximal causes and preventions like teaching styles (Godwin et al., 2016; Sherman, Rasmussen, & Baydala, 2008), or classroom management (Emmer & Sabornie, 2015).
This body of research has contributed important knowledge of one aspect of classroom disturbances. However, not all studies considered that the same behaviours can be differently perceived, interpreted, and judged from distinct perspectives (Crawshaw, 2015).
A second line of theory and research has revealed differential perceptions of classroom disturbances: most teachers feel stressed when their students frequently show deviant behaviours (E. Little, 2005), which may even result in burnout (Kokkinos, 2007). Many students perceive deviant behaviour of their classmates as disturbing too (Infantino & Little, 2005), but they usually deem it less troubling than teachers (Montuoro & Lewis, 2015). While most students admit that they get distracted by their classmates’ deviance, not all of them claim to feel annoyed (Schönbächler et al., 2009). Students who behave deviantly themselves often realise that this may disturb the others, but they worry much more about their own problems (Preuss-Lausitz, 2005). Altogether, this means that teachers and students perceive classroom disturbances differently according to distinct frames of perception (Wettstein, Ramseier, Scherzinger, & Gasser, 2016).
Role-specific traits influence the teachers’ and the students’ perception: teachers are accountable for all classroom interactions whereas the students are mainly concerned with their own learning, motivation and emotional wellbeing. This implies distinct valences and normative expectations that affect the way in which teachers and students perceive disturbances (Wettstein, Scherzinger, & Ramseier, 2018). Moreover, individual traits of students (Wettstein, Ramseier, & Scherzinger, 2018) and teachers (Hamre, Pianta, Downer, & Mashburn, 2008) influence their perception: teachers with decreasing self-efficacy beliefs, for instance, feel increasingly strained by deviant student behaviour (Arbuckle & Little, 2004; Dicke et al., 2014). Finally, contextual traits affect the perception: In instructional settings with rigid rules (Zevenbergen, 2001) or in classes with a low collective level of disturbances (Makarova, Herzog, & Schönbächler, 2014), occasional occurrences of deviance are perceived as strongly disturbing.
The SUGUS study integrates the above introduced two lines of theory and research. We conceptualise classroom disturbances as a co-constructed, interactionist phenomenon (Eckstein, Luger, Grob, & Reusser, 2016). Figure 1 illustrates this holistic understanding in a theoretical model (Eckstein, Grob, et al., 2016; after Wettstein, 2012). The arrows symbolise causal effects. The key argument is depicted in the upper part of the figure: classroom disturbances are constituted by two main elements – deviant student behaviour, and subjective perception of disturbance. We assume that deviance commonly disturbs teachers and students, yet the context as well as role-specific and individual traits of the “disturbed” affect the intensity in which they get distracted and/or annoyed. The present article focuses on this presumed core mechanism.
Beyond that, the model outlines how the assumed interaction could continue: teachers or students might react to behaviours that they have perceived as disturbing, e.g. with rebukes. The “disturber”, in turn, deems such behavioural reactions more or less fair or humiliating – depending on the context and his/her personal traits. The model’s circular structure visualises that student behaviour and the way in which it is perceived, interpreted, and judged are contextualised in a history of preceding interactions (Doyle, 2006).
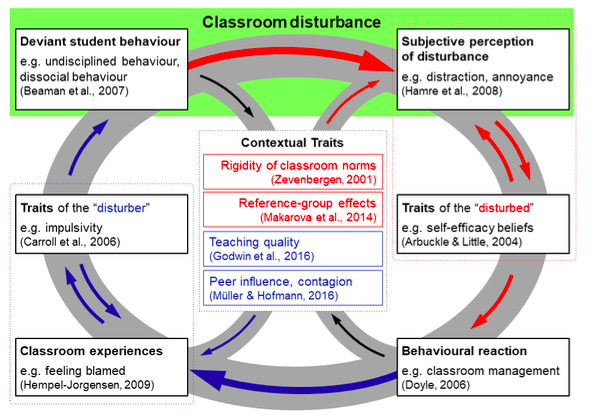
Figure 1. Interactionist model of the production and perception of classroom disturbances.
Rater effects stem from characteristics of the raters, the rating instrument, and the rating environment (Wolfe, 2004). In research on classroom disturbances, the above mentioned distinct frames of perception almost inevitably entail such rater effects: teachers, students, or external observers perceive and thus assess disturbances according to role-specific, individual and/or contextual conditions. Not all studies that focused on deviant student behaviour accounted for these issues sufficiently (Crawshaw, 2015). As a consequence, some findings available cannot be considered as purely objective information.
Extreme cases are rater biases, caused, for example, by halo effects (Hoyt, 2000), prejudiced, selective attention (Hofer, 1986), expectations triggered by labels like “ADHD” (Ohan, Visser, Strain, & Allen, 2011), or self-serving strategies (Fishbein & Ajzen, 2010). Further rater effects may be caused by differential opportunities in terms of the perceptibility of certain disturbances: if students behave deviantly during group work outside the classroom, for instance, only the present classmates will notice but not the teacher.
Moreover, high-inference rating instruments that require subjective interpretations from the raters amplify rater effects (Hoyt & Kerns, 1999; Südkamp, Kaiser, & Möller, 2012). Examples from research on classroom disturbances are vague formulations like “troublesome behaviours”, Likert-type frequency scales without clearly defined options (e.g. “seldom – sometimes – often”), or ratings of the whole class instead of individual students.
We designed the SUGUS study in order to investigate classroom disturbances according to our holistic conceptualisation; and we aimed to control for rater effects (Eckstein, Grob, et al., 2016). For these purposes, we conducted a multi-perspective survey in which teachers and students reported on individual students of their class (target students): the teachers described all students in their class, the students described themselves plus four randomly assigned classmates (Eckstein, Luger, Grob, & Reusser, 2018).
A first objective of the SUGUS study was to measure the incidence of deviant student behaviour as unbiased as possible: the respondents assessed the targets’ behaviours on a low-inference rating scale that we had developed in order to reduce the amount of potential rater effects. A second objective was to measure the respondents’ subjective perception of disturbance: the respondents assessed the intensity of distraction and annoyance the targets had caused according to their perspectives (Eckstein, Grob, et al., 2016). A third objective has been to analyse the relationship between deviance and perception of disturbance in each perspective and in the raters’ common view respectively. As the SUGUS study simultaneously investigates the behaviour of individual target students as well as three different perspectives on these targets, it breaks new ground in researching the (objective) production and the (subjective) perception of classroom disturbances.
The survey yielded a complex multitrait-multimethod data set which has been analysed by means of the “Correlated Trait – Correlated Method Minus One” [CT-C(M-1)] approach (Eid, Lischetzke, Nussbeck, & Trierweiler, 2003). This is a special variant of structural equation modelling which analyses the influence of latent traits on manifest indicators as well as the impact of the methods applied, e.g. different types of rating. A CT-C(M-1) model estimates trait factors and method factors. A trait factor comprises the amount of the measurements’ variance that is consistent across all methods applied. A method factor, by contrast, comprises the amount of variance which is specific to this method. One method is selected as comparison standard (reference method) for which no method factor is modelled. As a consequence, there is one method factor less than methods applied, hence “M-1” (Eid et al., 2008).
Psychologists developed this modelling technique originally and applied it, for instance, in personality research with multirater designs in order to analyse the consistency and the specificity of different perspectives on the mood of target persons (Carretero-Dios, Eid, & Ruch, 2011). Educational researchers applied this approach only recently in a few studies to analyse commonalities and differences between teacher and student ratings, e.g. regarding inclusion (Venetz, Zurbriggen, & Schwab, 2017).
The CT-C(M-1) model in this paper analyses teacher, peer and self-ratings of classroom disturbances. The model’s trait factors are the intersection of the three perspectives and represent, thus, the raters’ common view. In order to quantify the extent of this common view, consistency coefficients are calculated. As opposed to this, the model’s method factors comprise method-specific divergences from the common view. These divergences can be interpreted as rater effects which are quantified by specificity coefficients.
Furthermore, the model analyses correlations. The correlations between the trait factors estimate the strength of the constructs’ relation in the common view. They indicate how strongly deviant behaviour correlates with the perceived intensity of disturbance – in the shared perspective of all raters. The correlations between the method factors, by contrast, estimate the similarity of rater-specificities across different constructs. They represent the generalisability of rater effects.
The analyses provide answers to the following research questions:
(Q-1) Consistency of deviance ratings: To what extent are teacher, peer and self-ratings of deviant student behaviour consistent, and to what extent are they rater-specific? Because the ratings rest on a low-inference instrument, a larger extent of consistency than specificity is expected.
(Q-2) Specificity of the subjective perception of disturbance: To what extent are teacher, peer and self-ratings of the intensity of disturbance consistent, and to what extent are they rater-specific? Because perception primarily concerns the raters, a larger extent of specificity than consistency is expected.
(Q-3) Relation of deviance and perception of disturbance in the raters’ common view: How strongly do the trait factors of deviance and perception of disturbance correlate? Medium to strong correlations are expected: increasing deviance coincides with increasing distraction and annoyance.
(Q-4) Generalisability of rater-effects: How strongly do the method factors correlate? Medium correlations are expected: a rater-specific divergence in one construct coincides with analogous divergences in the other constructs.
In summer 2016, we conducted a written survey in 85 primary school classes (90.2% fifth grade, 9.8% mixed grades; students’ mean age: 11.73 years, SD: 0.52 years). All 85 class teachers and 1412 students out of a total of 1687 participated in the study. 275 students did not participate because they did not want to or because their parents did not allow it. The survey took place twice with one week in between and lasted a whole lesson each time. This research design had been pretested in a pilot study in 2014 (Eckstein, Reusser, Grob, & Hofstetter, 2015).
The surveys’ main focus was on individual target students: the teachers reported on all students in their class (teacher ratings), the students described themselves (self-ratings) plus four randomly assigned classmates (peer ratings). The participating students acted both as raters and targets, the non-participating students were rated only by their teachers. On both occasions, the same raters and targets were paired together with the aid of personalised questionnaires: the raters’ and the targets’ names were printed on a tear-off strip. Several measures were taken to guarantee the respondents anonymity. Supervising members of the project team reported that the students had been in a good mood after the survey (Eckstein et al., 2018).
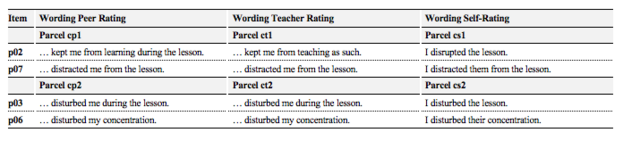
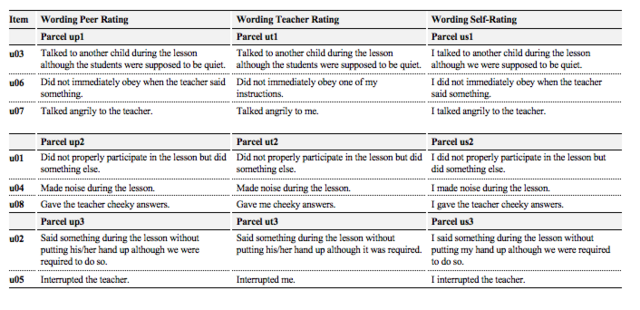
The questionnaire consisted of a general part (e.g. regarding teaching styles) and of a specific part that focused on the target students. This paper addresses the target-specific instruments exclusively; they were identical for teacher, peer and self-ratings except for the item wording (see Appendix A).
5.2.1 Deviant student behaviour
In the first part of the survey, we asked the respondents how frequently the target students had behaved deviantly in the preceding two weeks. The instrument comprised 18 items. The answering format consisted of six categories (“Never” to “5 times”) plus an option for free answers (“More frequently, namely: …”). The factorial structure covered two dimensions (Eckstein et al., 2018):
5.2.2 Subjective perception of disturbance
One week later, the respondents assessed the intensity of disturbance the targets had recently caused according to their subjective perception. They rated nine statements on a four-point rating scale (“Strongly disagree” to “Strongly agree”). Eight of these nine items were included in the factor analyses, which led to two dimensions (Eckstein et al., 2018):
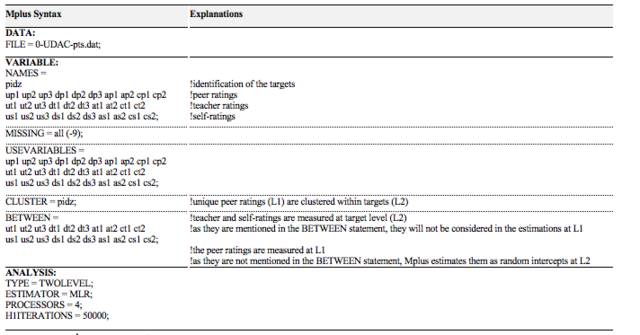
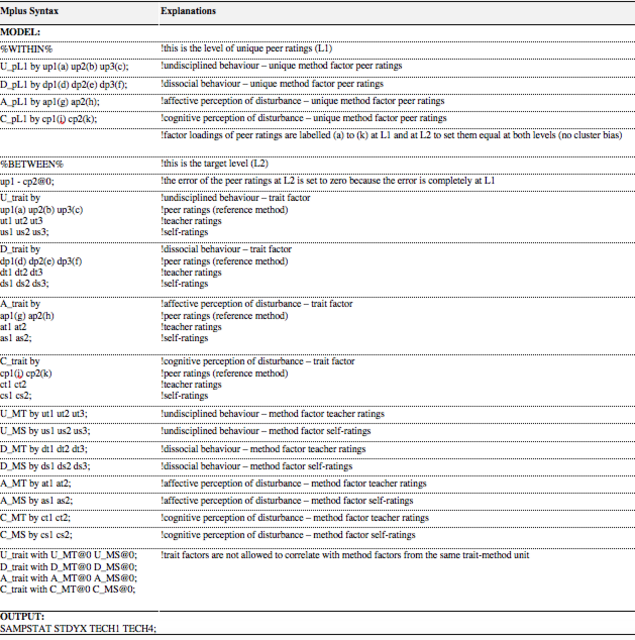
Following Eid et al. (2008) and Carretero-Dios et al. (2011), a two-level CT-C(M-1) model was set up and calculated in Mplus 8.0 (Muthén & Muthén, 2017). The model comprises four target-specific traits (undisciplined and dissocial behaviour, affective and cognitive perception of disturbance) which have been measured by three different methods (teacher, peer and self-ratings). The most important principles of the modelling are explained in this section. Further explanations follow in the results section and in Appendix B.
Level 2 (L2) is the level of the target students (nL2 = 1677) where the teacher ratings, the self-ratings, and the aggregated peer ratings have been modelled. Level 1 (L1), by contrast, is the level of unique peer ratings (nL1 = 5811). Each target student received 3.47 peer ratings on average. These unique peer ratings are nested within targets – they have been aggregated at L2 into error-free random intercepts (true scores).
Figure 2 provides a sketch of the model: Ovals symbolise latent factors, boxes represent manifest indicators (item parcels) with tiny grey arrows illustrating the measurement errors. The symbols are labelled with acronyms; in each case, the first letter fits the constructs’ denotation (e.g. “u”: undisciplined behaviour). Blue refers to teacher ratings, labelled with the letter “t”. Yellow refers to self-ratings, labelled with “s”, and red refers to peer ratings, labelled with “p”. The trait factors are white as they represent the shared perspective of all raters. The labels’ numbers refer to the item parcels which are numbered consecutively (see Appendix A). Unidirectional arrows illustrate factor loadings (λ), double arrows represent covariances (ψ).
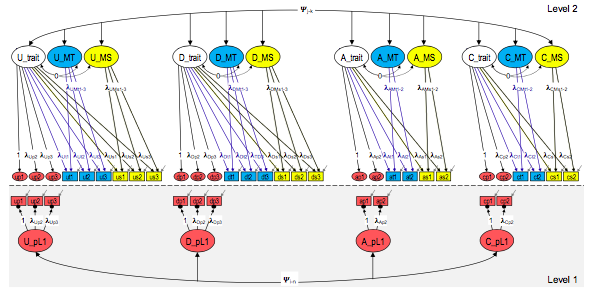
Figure 2. Sketch of the two-level CT-C(M-1) model.
I will explain the modelling in detail by an exemplary look at the construct “undisciplined behaviour”.
The white oval “U_trait” at L2 symbolises the latent trait factor of the targets’ undisciplined behaviour. U_trait unites the proportion of variance that is shared across all types of rating and thus represents the raters’ common view on the targets’ behaviour. The blue oval “U_MT” stands for the method factor of the teacher ratings; the yellow oval “U_MS” represents the method factor of the self-ratings. These method factors comprise the proportion of variance that is specific to those two types of rating (not shared with other types of rating). The blue boxes “ut1–ut3” symbolise the indicators of the teacher ratings, the yellow boxes “us1–us3” represent the indicators of the self-ratings. These indicators are influenced by the trait factor and by each according method factor. The influences are estimated by the factor loadings “λ”.
The small red ovals “up1–up3” at L2 illustrate the aggregated peer ratings. Unlike the teacher and self-ratings, these are not indicators at L2 but error-free random intercepts. No method factor was modelled for these aggregated peer ratings because they have been selected as the reference method with which the other types of rating are compared (comparison standard). It implies further that the peer ratings’ L2-scores are determined by the trait exclusively (no rater effect influences the aggregated peer ratings).
The red boxes “up1–up3” at L1 represent the manifest indicators of the unique peer ratings. The black dots on the edge of these boxes indicate that they have been aggregated into random intercepts at L2. Each target student was rated by 3.47 peers on average. These unique peer ratings per target may differ from one another. The red oval “U_pL1” at L1 illustrates a unique method factor of the unique peer ratings. This factor comprises the specific proportion of variance that is due to interindividual differences among the multiple peer raters per target (neither shared among peers, nor shared with other types of rating). It estimates the rater effect which influences the unique peer ratings.
Altogether, U_trait corresponds to the true scores per target, measured by the error-free aggregated peer ratings. In addition, U_trait encompasses the proportion of the teacher ratings and self-ratings that is consistent with the aggregated peer ratings. That is to say, U_trait is the intersection of the different perspectives. This intersubjectively consistent measurement can be considered as an approximation to an objective information about the targets undisciplined behaviour. The method factors comprise the disagreement among the raters.
The other three constructs have been modelled in the same way. The white ovals illustrate the trait factors of dissocial behaviour (D_trait), affective perception of disturbance (A_trait), and cognitive perception of disturbance (C_trait). The blue ovals represent the teachers’ method factors (_MT); the yellow ovals symbolise the self-ratings’ method factors (_MS); the red ovals at L1 represent the peer ratings’ unique method factors (_pL1). The red boxes at L1 stand for the unique peer ratings (dp1–dp3, ap1–ap2, cp1–cp2); the small red ovals at L2 illustrate the aggregated scores (labelled identically as the unique ratings). The blue boxes represent the teacher ratings (dt1–dt2, at1–at2, ct1–ct2); the yellow boxes represent the self-ratings (ds1–ds2, as1–as2, cs1–cs2).
Further measures have been adopted: The correlations between trait and method factors of the same trait-method unit are explicitly set to zero, because these factors are uncorrelated by definition (Eid et al., 2008). The factor loadings of the peer ratings are set equal at both levels to avoid cluster biases (Jak, Oort, & Dolan, 2013) which does not worsen the model fit (Chen, 2007). The 30 manifest indicators are item parcels. Parcelling was necessary for reducing the complexity of the model. This is justified because the analysis primarily aimed to estimate the relations between the constructs (T. D. Little, Cunningham, Shahar, & Widaman, 2002). Because the data are not normally distributed (Eckstein, Grob, & Reusser, 2017), the distinctive Mplus estimator with robust standard errors “MLR” (Finney & DiStefano, 2013) was applied. The MLR estimator uses all information available to model missing data (Muthén & Muthén, 2017).
The two-level CT-C(M-1) model fits the data well (𝜒2(MLR) = 1360.18, df = 372, p < .001; RMSEA = .021; CFI = 0.93; SRMRL1 = 0.04; SRMRL2 = 0.04). Figure 3 shows the estimated standardised factor loadings and correlations. Because all included parameters are significant (p < .05), the usual marking with asterisks (*) has been omitted for the sake of clarity. Furthermore, only correlations with |r| > 0.20 are displayed (a complete list of all correlations is provided in Table 2).
All factor loadings are significant and for the most part within an acceptable range. The standardised trait-factor loadings of the aggregated peer ratings amount to 1.00 because they are perfectly explained by the trait factor (measurement errors and rater effects are completely at L1). Compared to this, the freely estimated loadings of the teacher indicators on the trait factors are lower (.42 ≤ λ ≤ .70). The loadings of the self-ratings are even lower (.18 ≤ λ ≤ .40). This is a first indication that the aggregated peer ratings (reference method) converge more strongly with the teacher ratings than with the self-ratings.
Table 1 presents further results. As for the means (M), the target students on average only rarely showed undisciplined behaviour (.68 ≤ M ≤ 1.68) and even more rarely dissocial behaviour (.22 ≤ M ≤ .44). That the means are very low becomes evident if one keeps in mind that the rating scale was not limited to a fixed maximal number of incidents but included an option for free answers. Given these low mean incidences, it is not surprising that the target students on average were considered to be only little annoying (.27 ≤ M ≤ .70) and distracting (.39 ≤ M ≤ .53). The theoretical means of these two scales amount to 1.5.
The unstandardized trait factor loadings indicate level differences between the types of rating (Geiser, Eid, West, Lischetzke, & Nussbeck, 2012): loadings greater than 1.00 indicate that the pertaining self-ratings or teacher ratings are higher than the average peer rating (comparison standard); loadings lesser than 1.00 indicate lower self- or teacher ratings compared to the peer ratings. In sum, the teachers on average reported more incidents of undisciplined behaviours but fewer incidents of dissocial behaviours than the peers. Furthermore, the teachers on average reported a greater intensity of distraction but a lesser intensity of annoyance compared to the peers. The self-ratings on average are lower than the peer ratings as regards all four constructs.
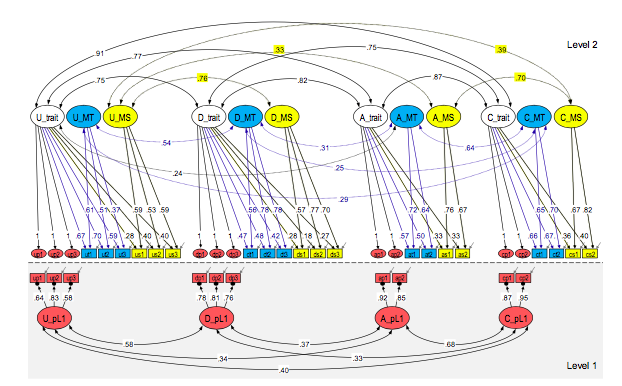
Figure 3. Standardised parameters according to the two-level CT-C(M-1) model estimation.
Using the formulas proposed by Eid et al. (2008), indicator-specific variance components were manually calculated. Consistency (C) is a measure of interrater agreement that quantifies the intersection between the raters’ distinct perspectives. It expresses the extent to which the aggregated peer ratings (reference method) explain the variance in the teacher ratings, in the self-ratings, and in the unique peer ratings. Specificity (S), by contrast, measures the rater effects: the coefficient is the proportion of variance in the ratings that is not consistent with the aggregated peer ratings. Technically speaking, it quantifies the overestimation or underestimation of other ratings compared to the average peer ratings. The reliability coefficient ( ω ) is the ratio of explained variance to total variance. This implies that unreliability (UnR = 1- ω ) can be accounted for by the measurement error.
Consistency, specificity, and unreliability add up to 1.00 per indicator, and their proportions are to be interpreted in percentages when multiplied by 100. The components’ meaning can be illustrated with an example from Table 1: the variance in the teacher ratings in ut1 is explained by the aggregated peer ratings to an extent of 45% (consistency). 38% of variance are method-specific, that is to say due to rater effects. The remaining 17% of variance can be accounted for by measurement errors (unreliability).
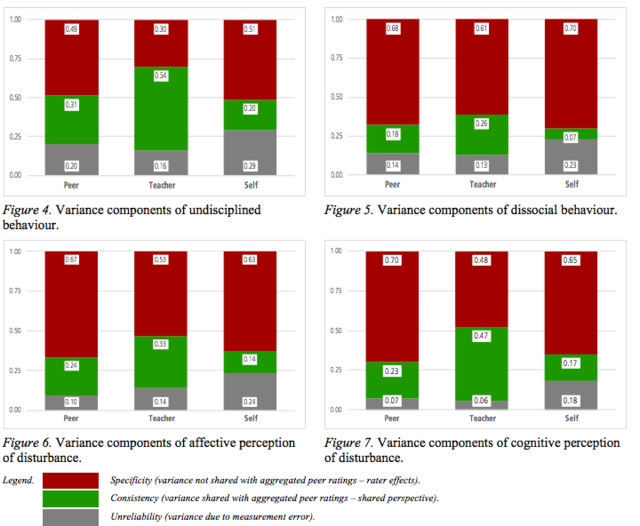
Some of the indicator-specific reliability coefficients are rather low. But as regards the whole constructs, reliability is considerably higher. Figures 4 to 7 illustrate the variance components for all constructs per method. The bottom-most, grey part of the pillars represents unreliability of the constructs (.06 ≤ UnR ≤ .29). The green part above stands for consistency (.07 ≤ C ≤ .54). The uppermost, red part displays specificity (.30 ≤ S ≤ .70).
Table 1
Factor Variance, Indicator-Specific Means, Unstandardized Factor Loadings, and Variance Components
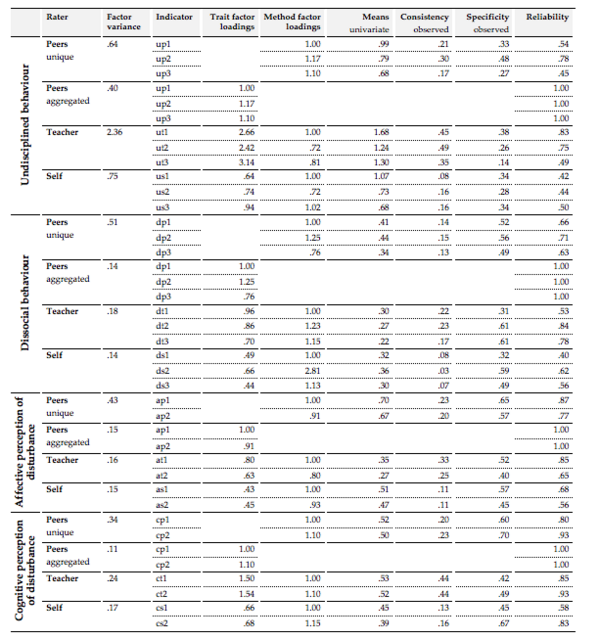
Note. “Factor variance” indicated for teacher ratings, self-ratings and unique peer ratings relates to the (unique) method factors. As for the aggregated peer ratings (reference method), “factor variance” relates to the trait factor. The factor loadings are non-standardised values. The loadings of the unique peer ratings on the unique method factors are equivalent to the loadings of the aggregated peer ratings on the trait factors (no cluster bias). Reliability of the error-free aggregated peer ratings amounts to 1.00 because they are completely explained by the trait factor (errors and method effects are completely at L1).
The self-ratings are marked by low consistency but high specificity over all constructs. This becomes most obvious in the construct “Dissocial behaviour”: only 7% of variance in the self-ratings can be explained by the aggregated peer ratings (reference method) whereas 70% of variance are rater-specific and can thus be explained by rater effects.
The variance in teacher ratings of the construct “Undisciplined behaviour” can be explained to an extent of 54% by the aggregated peer ratings (consistency). With respect to the construct “Dissocial behaviour”, by contrast, consistency only amounts to 26%. This discrepancy is unexpected because both constructs were measured with analogous low-inference scales that were assumed to lead to similar results. Moreover, we expected larger consistency coefficients for all deviance ratings. Also contrary to our expectations, the teacher ratings of the construct “Cognitive perception of disturbance” are to an extent of 47% consistent with the aggregated peer ratings. Since this is a measure of subjective perceptions, we expected a lower consistency coefficient.
The unique peer ratings are to an extent of 18 to 31% consistent with the aggregated scores. In itself, the values in this range are rather low. What is even more surprising, however, is that all consistency coefficients of the unique peer ratings are lower than those of the teacher ratings. This means that the teacher ratings converge more strongly with the peers’ aggregated scores than the unique peer ratings – out of which the aggregated scores had originally been calculated.
Table 2 shows a complete list of the correlations between the latent factors. Significant results (p < .05) are marked by an asterisk (*). The table is made up of sectors (I to VII), which are described in the following.
Table 2
Interfactor Correlations
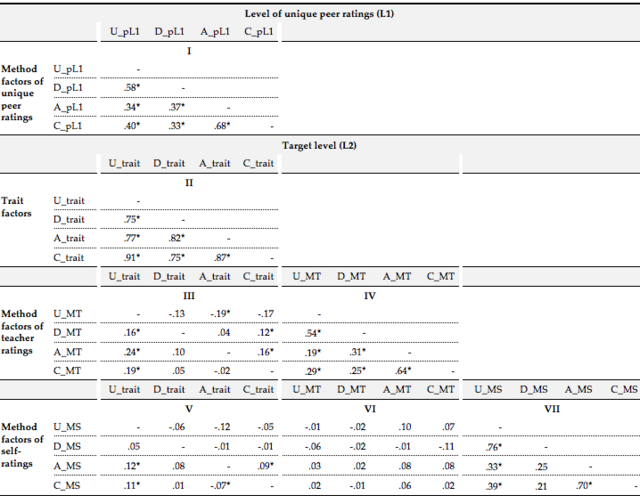
Sector I shows the correlations of the unique method factors. All coefficients are positive and significant (.33* ≤ r ≤ .68*). Thus, the rater-specificity of the unique peer ratings is largely generalizable: if a peer rater overestimates a target in one construct (compared to the aggregated score), this peer tends to overestimate the same target in other constructs too. Or vice versa: underestimation in one construct coincides with underestimation in the other constructs. The correlations between the method factors of the teacher ratings (Sector IV) and between the method factors of the self-ratings (Sector VII) can be interpreted analogously.
Sector II includes the correlations between the trait factors which estimate the strength of the constructs’ relation in the raters’ common view (measured by the relatively small intersection of the different types of rating). All these correlations are positive and significant: the more frequently targets show undisciplined behaviour, the more frequently they behave in dissocial ways too (r = .75*). Besides, the more frequently the targets show undisciplined behaviour, the more annoyed (r = .77*) and distracted (r = .91*) the respondents get. The same holds true with respect to dissocial behaviour (.75* ≤ r ≤ .82*). Although such findings were expected, the actual correlations are so high that they raise questions concerning discriminant validity.
Sector III displays the correlations between the trait factors and the method factors of the teacher ratings. The highest positive correlation indicates a tendency that targets who show increasingly frequent indiscipline according to the common view (U_trait) are perceived as increasingly (r = .24*) annoying in their teacher’s specific perspective (A_MT). The correlations between the trait factors and the method factors of the self-ratings in Sector V can be interpreted in analogous ways, but they are rather low or not significant.
Sector VI lists the correlations between the method factors of the teacher ratings and the self-ratings. None of the coefficients is significant. This means that the teacher ratings and the self-ratings do not share any variance that they do not share with the aggregated peer ratings.
According to our theoretical framework, classroom disturbances consists of an objective core that not all persons involved perceive as equally disturbing (Eckstein, Grob, et al., 2016). We assume that deviant student behaviour commonly distracts and annoys teachers and students, yet the intensity of a perceived disturbance is affected by role-specific, individual, and contextual conditions. The SUGUS study investigates this interactionist phenomenon by means of a multi-perspective survey. Based on teacher, peer and self-ratings we measured the incidence of deviant student behaviour and the respondents’ subjective perception of disturbance. The aim of this paper has been to analyse commonalities and differences between the three perspectives with a two-level CT-C(M-1) model. Four research questions have been pursued and can be answered as follows:
(Q-1) Consistency of the deviance ratings. Because of our low-inference instrument, we assumed to obtain rather unbiased ratings of deviant student behaviours. Therefore, we supposed that the teacher, peer and self-ratings would be largely consistent. In other words, we expected only minor rater effects. This hypothesis needs to be rejected. The extent to which the ratings are consistent merely amounts to 7 to 54%. As against this, rater effects explain between 30 and 70% of the measurements’ variance. Only the teacher ratings of the construct “Undisciplined behaviour” are more consistent (54%) than specific (30%). In all other cases, the rater-specific divergences make up the larger proportion.
These unexpectedly large rater effects may in part be accounted for by the respondents’ role-specific frames of perception (Scherzinger, Wettstein, & Wyler, 2017). As far as the self-ratings are concerned, the students may have underestimated the frequency of their own dissocial behaviour in terms of a self-serving strategy (70% specificity). This interpretation is supported by the low means of the self-ratings and by the unstandardized trait factor loadings of the self-ratings which are lower than those of the peer ratings.
The rater effects that influence the teacher ratings of dissocial behaviour (61% specificity) may be explained by differential opportunities in terms of its perceptibility: students probably hide dissocial behaviours due to fear of sanctions so that their teacher does not perceive every incident. This would explain why the teachers on average reported fewer incidents of dissocial behaviour compared to the average peer ratings according to the unstandardized trait factor loadings.
Undisciplined behaviour, by contrast, is socially less disapproved and therefore less hidden and better perceptible for the teachers (30% specificity). According to the unstandardized trait factor loadings, the teachers on average reported more incidents of indiscipline than the peers. This may be due to the teachers’ sensitivity to disciplinary issues in class. Maybe this implies further that the peers underestimated the indiscipline of their classmates.
(Q-2) Specificity of the subjective perception of disturbance. The assumption was that specificity is larger than consistency. This hypothesis is supported by the results: up to 70% of variance can be accounted for by rater effects. Solely regarding the teachers’ cognitive perception of disturbance, the ratio is less pronounced than expected (47% consistency vs. 48% specificity). This implies that teachers and peer raters on average agreed to 47% on the intensity of distraction the targets had caused. This finding is surprising because it rests on highly subjective measurements so that the proportion of specificity was expected to be larger. In all other cases, specificity clearly outweighs consistency as expected. This becomes particularly evident in the self-ratings (63 to 65% specificity). The low means and the unstandardized trait factor loadings indicate that the students probably underestimated themselves in this respect compared to the average peer ratings, which might be once more a consequence of self-serving biases.
The rater effects that influence the teachers’ affective perception of disturbance (53% specificity) can be outlined by the level difference revealed by the unstandardized trait factor loadings: the teachers on average described the targets as less annoying than the peers. The low means imply that the teachers described most students as not annoying. Maybe these ratings are a consequence of the teachers’ professional ethos.
(Q-3) Relation of deviance and perception of disturbance in the raters’ common view. We expected medium to strong correlations between the four trait factors. This hypothesis is supported by the results: the more frequently the targets show deviant behaviour (according to the common view), the more annoyed and distracted the respondents get. Some of these correlations are so high, however, that they raise the question of whether the constructs discriminate sufficiently. It has to be considered, for instance, whether the trait factors “Undisciplined behaviour” and “Cognitive perception of disturbance” should be merged into one super factor. This merging would mean to equate the incidence of indiscipline and the intensity of distraction as two undistinguishable aspects of the same phenomenon. We refrained from doing so because the merging of factors should result in theoretically explicable constructs (Kleinke, Schlüter, & Christ, 2017). In our view, the potential super factor would represent an obscure mixture of two distinct constructs. Furthermore, the constructs discriminate well in the raters’ specific perspectives (the method factors correlate much less strongly).
(Q-4) Generalisability of rater-effects. The assumption was that the rater effects tend to be similar across the different constructs. The results support this hypothesis. The analyses showed medium to high correlations between the rater-specific method factors (.19* ≤ r ≤ .76*). Raters who overestimated a target in one construct tended to overestimate this target regarding the other constructs as well (compared to the aggregated peer ratings). The same holds true vice versa: underestimation in one construct coincides with underestimation in the other constructs. This indicates that the rater effects are largely generalisable.
The aggregated peer ratings have been selected as reference method because multiple ratings per target were available so that occasional exaggerations and trivialisations were assumed to even out. Therefore, the peer ratings were supposed to be more precise than the other types of ratings. However, more information would be needed to verify this assumption, e.g. ratings from external observers (Wettstein, Scherzinger, et al., 2018). As an alternative, the generalisability of ratings might be increased in longitudinal study designs, e.g. by means of the experience sampling method (Zurbriggen, Venetz, & Hinni, 2018).
The analyses have revealed that rater effects clearly dominated the teachers’ and the students’ reports of classroom disturbances. This finding supports the key argument of our theoretical model (Eckstein, Grob, et al., 2016): classroom disturbances consist of an objective core (deviant student behaviour) that the persons involved may perceive, interpret and judge differently (subjective perception of disturbance). The detected differences between the teachers’ and the students’ perspectives, for example, indicate role-specific frames of perception which most likely can be explained by their distinct tasks, aims and normative expectations. The teachers, for instance, need to notice and to moderate even minor forms of indiscipline in order to prevent more serious disturbances because of their pedagogical mandate. This is probably one reason why they reported more incidents of undisciplined behaviours than the students on average. Furthermore, the differences between the multiple peer ratings per target student indicate that individual traits affect the raters’ perception, interpretation and judgement of disturbances. These interindividual differences may be explained partly by the raters’ general sensitivity to disturbance, as some students (and teachers) get more easily distracted or annoyed by the same occurrences than others (Eckstein, 2018). Another part of the ratings’ specificity may be explained by the quality of the raters’ relationship to the targets which evolved from their preceding interactions (Doyle, 2006). It can be assumed, for example, that students observe close friends in class differently than classmates who they dislike. In the case of the teachers, Hofer (1986) revealed that they monitor their students according to preconceived categories like “the disturber” or “the top pupil” which can lead to biased perceptions and thus to inadequate reactions. Referring to the labelling approach (Becker, 1963), such mechanisms can be interpreted as a reciprocal dependency of the production and the perception of classroom disturbances. The presumed long-term process of this interactionist phenomenon is visualised by our model’s circular structure.
Beyond that, the large extent of the rater effects might be associated with a general epistemological problem: considering the subjectivity of human perception, it seems questionable whether classroom disturbances can be investigated in the sense of objective matters of fact. A methodological attempt to deal with this problem in future studies could consist in complementing surveys with video studies (Janík & Seidel, 2009) using direct behaviour ratings (Christ, Riley-Tillman, & Chafouleas, 2009). This much information might enable researchers at least to further approximate the objective core of classroom disturbances. Researchers without the resources to apply such mixed method designs, by contrast, need to select the most appropriate source of information with respect to the aims of their study (Kunter & Baumert, 2006). In any case, the application of low-inference instruments seems recommendable. The consistency coefficients of our deviance scale amount up to 54% which is larger than usual interrater agreement in classroom research (Wagner et al., 2016).
As a final point, the findings have practical implications: the large extent of the rater effects implies that the labelling of single “problem students” (Hunt et al., 1989) is questionable from an ethical point of view. Therefore, it is crucial for teachers to be aware of possible biases of their own perception so that they are able to reflect self-critically on their judgements on their students. Furthermore, teachers who are aware that classroom disturbances are an interactionist problem may reflect consciously on various intervention strategies (Thommen & Wettstein, 2007).
The two-level CT-C(M-1) model that has been presented in this paper forms the basis for further analyses in the context of the SUGUS study. As a next step, we plan to investigate causes and preventions of classroom disturbances according to our theoretical model. However, these analyses need to overcome further methodological challenges (Koch, Holtmann, Bohn, & Eid, 2017).
The CT-C(M-1) modelling technique could henceforth serve as an advantageous tool in educational research, because it estimates the common view of teachers and students as well as rater-specific divergences. It could be applied, for instance, in studies on instructional quality (Pham et al., 2012) in order to investigate causes of interrater (dis-)agreement.
I would like to thank the Swiss National Science Foundation for supporting the SUGUS study (Project No.: 100019_152722) and the project leader Prof. em. Dr. Kurt Reusser for his substantial support and his invaluable encouragement.Furthermore, I would like to thank two anonymous reviewers for providing judicious comments that helped to improve this articles’ quality.
Arbuckle, C., & Little, E. (2004). Teachers’ perceptions and
management of disruptive classroom behaviour during the middle
years. Australian Journal of Educational and Developmental
Psychology, 4, 59–70.
Beaman, R., Wheldall, K., & Kemp, C. (2007). Recent research
on troublesome classroom behaviour: A review. Australasian
Journal of Special Education, 31(1), 45–60.
doi:10.1080/10300110701189014
Becker, H. S. (1963). Outsiders. Studies in the Sociology
of Deviance. New York, NY: The Free Press.
Carretero-Dios, H., Eid, M., & Ruch, W. (2011). Analyzing
multitrait-mulitmethod data with multilevel confirmatory factor
analysis: An application to the validation of the State-Trait
Cheerfulness Inventory. Journal of Research in Personality,
45(2), 153–164. doi:10.1016/j.jrp.2010.12.007
Carroll, A., Houghton, S., Taylor, M., West, J., &
List-Kerz, M. (2006). Responses to interpersonal and physically
provoking situations. Educational Psychology, 26(4),
483–498. doi:10.1080/14616710500342424
Chen, F. F. (2007). Sensitivity of goodness of fit indexes to
lack of measurement invariance. Structural Equation
Modeling, 14(3), 464–504. doi:10.1080/10705510701301834
Christ, T. J., Riley-Tillman, T. C., & Chafouleas, S. M.
(2009). Foundation for the development and use of Direct
Behavior Rating (DBR) to assess and evaluate student behavior. Assessment
for Effective Intervention, 34(4), 201–213.
doi:10.1177/1534508409340390
Crawshaw, M. (2015). Secondary school teachers’ perceptions of
student misbehaviour: A review of international research, 1983
to 2013. Australian Journal of Education, 59(3),
293–311. doi:10.1177/0004944115607539
Dicke, T., Parker, P. D., Marsh, H. W., Kunter, M., Schmeck, A.,
& Leutner, D. (2014). Self-efficacy in classroom management,
classroom disturbances, and emotional exhaustion: A moderated
mediation analysis of teacher tandidates. Journal of
Educational Psychology, 106(2), 569–583.
doi:10.1037/a0035504
Doyle, W. (2006). Ecological approaches to classroom management.
In C. Evertson & C. Weinstein (Eds.), Handbook of
classroom management: Research, practice and contemporary
issues (pp. 97–125). Mahwah, NJ: Erlbaum.
Eckstein, B. (2018). Unterrichtsstörungen: eine Frage der
Perspektive? [Classroom Disturbances: a Question of
Perspective?]. In S. Schwab, G. Tafner, S. Luttenberger, H.
Knauder, & M. Reisinger (Eds.), Von der Wissenschaft
in die Praxis? Zum Verhältnis von Forschung und Praxis in der
Bildungsforschung (pp. 78–92). Münster: Waxmann.
Eckstein, B., Grob, U., & Reusser, K. (2016).
Unterrichtliche Devianz und subjektives Störungsempfinden.
Entwicklung eines Instrumentariums zur Erfassung von
Unterrichtsstörungen [Deviant Classroom Behavior and Subjective
Perception of Disturbance. Development of an Instrument to
assess Classroom Disturbances]. Empirische Pädagogik, 30(1),
113–129.
Eckstein, B., Grob, U., & Reusser, K. (2017).
Production and Perception of Classroom Disturbances. Personal
and Contextual Facets . Paper presented at the EARLI
Biennial Main Conference. Education in the Crossroads of Economy
and Politics, Tampere (FIN).
Eckstein, B., Luger, S., Grob, U., & Reusser, K. (2016).
SUGUS – Studie zur Untersuchung gestörten Unterrichts.
Ergebnisbericht der Hauptstudie – anonymisierte Fassung [SUGUS
- Study to Investigate Classroom Disturbances. Result Report
of the Main Study - anonymised Version] . Zürich:
Universität Zürich.
Eckstein, B., Luger, S., Grob, U., & Reusser, K. (2018).
SUGUS: Technischer Bericht der quantiativen Teilstudie.
Studiendesign, Stichprobe und Skalendokumentation [SUGUS:
Technical Report of the quantitative Study. Study Design,
Sample and Documentation of the Scales] . Zürich:
Universität Zürich.
Eckstein, B., Reusser, K., Grob, U., & Hofstetter, A.
(2015). SUGUS – Studie zur Untersuchung gestörten
Unterrichts. Kurzer Ergebnisbericht der Vorstudie –
anonymisierte Fassung [SUGUS - Study to Investigate Classroom
Disturbances. Short Result Report of the Pilot Study -
anonymised Version] . Zürich: Universität Zürich.
Eid, M., Lischetzke, T., Nussbeck, F., & Trierweiler, L.
(2003). Separating trait effects from trait-specific method
effects in multitrait-multimethod models: A multiple-indicator
CT-C (M-1) model. Psychological Methods, 8(1), 38–60.
doi:10.1037/1082-989X.8.1.38
Eid, M., Nussbeck, F., Geiser, C., Cole, D. A., Gollwitzer, M.,
& Lischetzke, T. (2008). Structural equation modeling of
multitrait-multimethod data: Different models for different
types of methods. Psychological Methods, 13(3),
230–253. doi:10.1037/a0013219
Emmer, E. T., & Sabornie, E. J. (2015). Handbook of
classroom management(2nd ed.). New York, NY: Routledge.
Finney, S. J., & DiStefano, C. (2013). Nonnormal and
categorical data in structural equation models. In G. R. Hancock
& R. O. Mueller (Eds.), Structural equation modeling: A
second course(2nd ed., pp. 439–492). Charlotte, NC:
Information Age Publishing.
Fishbein, M., & Ajzen, I. (2010). Predicting and
changing behavior. The reasoned action approach. New
York, NY: Psychology Press.
Geiser, C., Eid, M., West, S. G., Lischetzke, T., &
Nussbeck, F. W. (2012). A comparison of method effects in two
confirmatory factor models for structurally different methods. Structural
Equation Modeling: A Multidisciplinary Journal, 19(3),
409-436.
Godwin, K. E., Almeda, M. V., Seltman, H., Kai, S., Skerbetz, M.
D., Baker, R. S., & Fisher, A. V. (2016). Off-task behavior
in elementary school children. Learning and Instruction, 44,
128–143. doi:10.1016/j.learninstruc.2016.04.003
Hamre, B. K., Pianta, R. C., Downer, J. T., & Mashburn, A.
J. (2008). Teachers’ perceptions of conflict with young
students: Looking beyond problem behaviors. Social
Development, 17(1), 115–136.
doi:10.1111/j.1467-9507.2007.00418.x
Hempel-Jorgensen, A. (2009). The construction of the “ideal
pupil” and pupils’ perceptions of “misbehaviour” and discipline:
Contrasting experiences from a low-socio-economic and a
high-socio-economic primary school. British Journal of
Sociology of Education, 30(4), 435–448.
doi:10.1080/01425690902954612
Hofer, M. (1986). Sozialpsychologie erzieherischen
Handelns [Social psychology of education] . Goettingen:
Hogrefe.
Hoyt, W. T. (2000). Rater bias in psychological research: When
is it a problem and what can we do about it? Psychological
Methods, 5(1), 64-86. doi:10.1037/1082-989X.5.1.64
Hoyt, W. T., & Kerns, M.-D. (1999). Magnitude and moderators
of bias in observer ratings: A meta-analysis. Psychological
Methods, 4(4), 403–424.
Hunt, D., Carline, J., Tonesk, X., Yergan, J., Siever, M., &
Loebel, J. (1989). Types of problem students encountered by
clinical teachers on clerkships. Medical education, 23(1),
14–18.
Infantino, J., & Little, E. (2005). Students’ perceptions of
classroom behaviour problems and the effectiveness of different
disciplinary methods. Educational Psychology, 25(5),
491–508. doi:10.1080/0144341050004654
Jak, S., Oort, F. J., & Dolan, C. V. (2013). A test for
cluster bias: Detecting violations of measurement invariance
across clusters in multilevel data. Structural Equation
Modeling, 20(2), 265–282.
doi:10.1080/10705511.2013.769392
Janík, T., & Seidel, T. (Eds.). (2009). The Power of
Video Studies in Investigating Teaching and Learning in the
Classroom . Münster: Waxmann.
Kleinke, K., Schlüter, E., & Christ, O. (2017).
Strukturgleichungsmodelle mit Mplus. Eine praktische
Einführung [Structural equation modelling with Mplus. A
practical introduction] (2nd ed.). Berlin: de Gruyter.
Koch, T., Holtmann, J., Bohn, J., & Eid, M. (2017).
Explaining General and Specific Factors in Longitudinal,
Multimethod, and Bifactor Models: Some Caveats and
Recommendations. Psychological Methods.
doi:10.1037/met0000146
Kokkinos, C. M. (2007). Job stressors, personality and burnout
in primary school teachers. British Journal of Educational
Psychology, 77, 229–243. doi:10.1348/000709905X90344
Kunter, M., & Baumert, J. (2006). Who is the expert?
Construct and criteria validity of student and teacher ratings
of instruction. Learning Environments Research, 9(3),
231-251. doi:10.1007/s10984-006-9015-7
Little, E. (2005). Secondary school teachers’ perceptions of
students’ problem behaviours. Educational Psychology, 25(4),
369–377. doi:10.1080/01443410500041516
Little, T. D., Cunningham, W. A., Shahar, G., & Widaman, K.
F. (2002). To parcel or not to parcel: Exploring the question,
weighing the merits. Structural Equation Modeling, 9(2),
151–173. doi:10.1207/S15328007SEM0902_1
Makarova, E., Herzog, W., & Schönbächler, M.-T. (2014).
Wahrnehmung und Interpretation von Unterrichtsstörungen aus
Schülerperspektive sowie aus Sicht der Lehrpersonen [Perception
and interpretation of classroom disturbances in the perspectives
of students and teachers]. Psychologie in Erziehung und
Unterricht, 61(2), 127–140.
Montuoro, P., & Lewis, R. (2015). Student perceptions of
misbehavior and classroom management. In E. T. Emmer & E. J.
Sabornie (Eds.), Handbook of classroom management(2nd
ed., pp. 344–362). New York, NY: Routledge.
Müller, C. M., & Hofmann, V. (2016). Does being assigned to
a low school track negatively affect psychological adjustment? A
longitudinal study in the first year of secondary school.
School Effectiveness and School Improvement: An International
Journal of Research, Policy and Practice, 27 (2),
95–115. doi:10.1080/09243453.2014.980277
Muthén, B. O., & Muthén, L. K. (2017). Mplus user’s
guide(8th ed.). Los Angeles, CA: Muthén & Muthén.
Ohan, J., Visser, T. A. W., Strain, M. C., & Allen, L.
(2011). Teachers’ and education students’ perceptions of and
reactions to children with and without the diagnostic label
“ADHD”. Journal of School PSychology, 49, 81–105.
doi:10.1016/j.jsp.2010.10.001
Pham, G., Koch, T., Helmke, A., Schrader, F.-W., Helmke, T.,
& Eid, M. (2012). Do teachers know how their teaching is
perceived by their pupils? Procedia-Social and Behavioral
Sciences, 46, 3368-3374. doi:10.1016/j.sbspro.2012.06.068
Preuss-Lausitz, U. (2005). Verhaltensauffällige Kinder
integrieren. Zur Förderung der emotionalen und sozialen
Entwicklung [Integrating children with behavioural problems.
Fostering the emotional and social development] .
Weinheim: Beltz.
Scherzinger, M., Wettstein, A., & Wyler, S. (2017).
Unterrichtsstörungen aus der Sicht von Schülerinnen und Schülern
und ihren Lehrpersonen. Ergebnisse einer Interviewstudie zum
subjektiven Erleben von Störungen [Classroom disturbances in the
perspectives of students and teachers. Findings of an interview
study on the subjective experience of disturbances] Vierteljahresschrift
für Heilpädagogik und ihre Nachbargebiete, 86 (1), 70–83.
doi:10.1026/0049-8637/a000159.
Schönbächler, M.-T., Makarova, E., Herzog, W., Altin, Ö., Känel,
S., Lehmann, V., & Milojevic, S. (2009).
Klassenmanagement und kulturelle Heterogenität: Ergebnisse 2.
Forschungsbericht Nr. 37. [Classroom management and cultural
heterogeneity: Results 2. Research report no. 37] .
Bern: Universität Bern.
Sherman, J., Rasmussen, C., & Baydala, L. (2008). The impact
of teacher factors on achievement and behavioural outcomes of
children with Attention Deficit/Hyperactivity Disorder (ADHD): A
review of the literature. Educational Research, 50(4),
347–360. doi:10.1080/00131880802499803
Südkamp, A., Kaiser, J., & Möller, J. (2012). Accuracy of
teachers’ judgments of students’ academic achievement: A
meta-analysis. The Journal of Educational Psychology, 104(3),
743–762. doi:10.1037/a0027627
Thommen, B., & Wettstein, A. (2007). Toward a
Multi-Level-Analysis of Classroom Disturbances. European
Journal of School Psychology, 5 (1), 65-82.
Venetz, M., Zurbriggen, C., & Schwab, S. (2017). What
do teachers think about their students’ inclusion? Consistency
of self- and teacher reports . Paper presented at the
EARLI Biennial Main Conference. Education in the Crossroads of
Economy and Politics, Tampere (FIN).
Wagner, W., Gollner, R., Werth, S., Voss, T., Schmitz, B., &
Trautwein, U. (2016). Student and teacher ratings of
instructional quality: Consistency of ratings over time,
agreement, and predictive power. Journal of Educational
Psychology, 108(5), 705–721.
Wettstein, A. (2012). A conceptual frame model for the analysis
of aggression in social interactions. Journal of Social,
Evolutionary, and Cultural Psychology, 6(2), 141–157.
doi:10.1037/h0099218
Wettstein, A., Ramseier, E., & Scherzinger, M. (2018). Eine
Mehrebenenanalyse zur Schülerwahrnehmung von Störungen im
Unterricht der Klassen- und einer Fachlehrperson [A multilevel
analysis of the students’ perception of classroom disturbances
during the instruction of class teachers and subject teachers].
Psychologie in Erziehung und Unterricht, 65(1), 1–16.
doi:10.2378/peu2018.art01d
Wettstein, A., Ramseier, E., Scherzinger, M., & Gasser, L.
(2016). Unterrichtsstörungen aus Lehrer- und Schülersicht.
Aggressive und nicht aggressive Störungen im Unterricht aus der
Sicht der Klassen-, einer Fachlehrperson und der Schülerinnen
und Schüler [Classroom disturbances in the perspectives of
teachers and students. Aggressive and non-aggressive
disturbances during instruction in the view of class teachers,
subject teachers, and students]. Zeitschrift für
Entwicklungspsychologie und pädagogische Psychologie, 48
(4), 171–183. doi:10.1026/0049-8637/a000159
Wettstein, A., Scherzinger, M., & Ramseier, E. (2018).
Unterrichtsstörungen, Beziehung und Klassenführung aus Lehrer-,
Schüler- und Beobachterperspektive [Classroom disturbances,
relationship, and classroom management in the perspectives of
teachers, students and external observers]. Psychologie in
Erziehung und Unterricht, 65(1), 58-74.
doi:10.2378/peu2018.art04d
Wolfe, E. W. (2004). Identifying rater effects using latent
trait models. Psychology Science, 46, 35-51.
Zevenbergen, R. (2001). Mathematics, social class, and
linguistic capital. In B. Atweh, H. Forgasz, & B. Nebres
(Eds.), Sociocultural research on mathematics education(pp.
201–215). Mahwah, NJ: Erlbaum.
Zurbriggen, C., Venetz, M., & Hinni, C. (2018). The quality
of experience of students with and without special educational
needs in everyday life and when relating to peers. European
journal of special needs education, 33(2), 205–220.
doi:10.1080/08856257.2018.1424777

Note: Items d16, d17, and d18 included an extra prompt: “How was it shortly before or after the lesson, for example on your way to school or during the break?” The intention behind this addition was to address dissocial forms of behaviour that had occurred outside the classroom but might have had consequences during the lesson, for example if the students involved had still been emotionally upset.
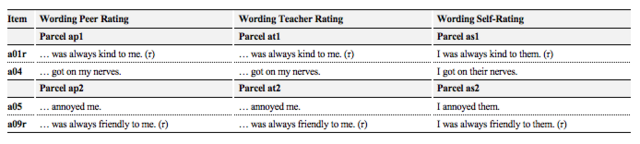
Note. Items a01r and a09r had been positively worded so that the raters could describe the targets in a favourable way in order to prevent a negative stigmatisation of the target student due to the survey. The original answers were afterwards recoded into inverted values (r).