![]()
Frontline Learning Research Vol.5 No. 1 (2017) 76
- 84
ISSN 2295-3159
aFreiburg University of
Education, Department of Psychology, Germany
bLudwig-Maximilians-University Munich, Department of
Psychology, Germany
Article received 4 July / revised 21 November / accepted 29 November / available online 28 February
The reluctance of children to revise their prior beliefs is a prominent phenomenon in the reasoning literature. One way to facilitate belief change is offering explanations, and this study examined whether highlighting (counter)evidence with diagrams leads to belief revision to the same extent. Altogether 134 preschoolers and second-graders (5- and 7-year-olds, respectively) were presented with either counterintuitive data or explanations, both refuting a strong commonly held belief concerning the relation between two variables (e.g. eating carrots improves vision). In the explanation condition, we presented children with an explanatory underlying mechanism for the unexpected causal relation (e.g. spinach and carrots contain the same amount of vitamin A, with both improving vision). In the diagram condition, children were presented with empirical data displayed in a bar graph (non-covariation), which also disconfirmed the initial belief. In both age groups and both conditions we found significant numbers of belief revision with high certainty ratings concerning the new belief. Belief change was more pronounced in second-graders, who in addition showed significantly more changes in the diagram condition than in the explanation condition. These findings suggest that the perceptual saliency of (counter)evidence helps children to correctly evaluate hypotheses, which supports changes in their prior belief.
Keywords: belief revision, hypothesis evaluation, primary-school children, diagram, explanation
The prominent role of prior knowledge in the evaluation of evidence is a well-documented phenomenon in the reasoning literature (e.g., Croker & Buchanan, 2011; Kuhn, Amsel, & O’Laughlin, 1988). Especially when evidence is inconsistent with their favored hypotheses or beliefs, children often refuse to update their initial beliefs; rather, they distort their interpretation of the data so that these are in accordance with their initially held belief (Klaczynski, 2001; Kuhn et al., 1988). The distortion typically entails that children ignore data that are inconsistent with their initial belief, that they selectively attend to only those parts of the data that are consistent with their initial belief, or that they even misinterpret the data (Amsel & Brock, 1996; Chinn & Brewer, 1993; Chinn & Malhotra, 2002; Kuhn, et al., 1988; Masnick, Klahr, & Knowles, 2016).
A common explanation for this phenomenon has been proposed by Kuhn (e.g., Kuhn, 2010). Kuhn suggests that young children do not understand that theory (beliefs) and evidence (data) are two epistemologically distinct categories. Specifically, she argues that young children do not understand that theories need to be fully backed up by evidence, which would result in their selective interpretation of data. In a well-known study, Kuhn and her colleagues (1988) asked children to interpret data that suggested a causal relation between a set of variables (e.g., different kinds of food, being healthy or not). Specifically, sixth- and ninth graders, as well as adults, were presented with fictitious data that, so were told, was obtained in a boarding school, in which different groups of students consumed four different kinds of food or beverage (diet coke or regular coke, baked potato or fries, oranges or apples, and Special K or granola). Some of the students in the boarding school felt sick after lunch, others were healthy. Two variables contradicted the prior belief of the participants and two variables were in accordance with the participants’ beliefs concerning the impact of the different food items on the health of the students When children were asked whether a specific kind of food caused the students’ sickness, Kuhn and colleagues found that only the older children and the adults used evidence-based reasoning (i.e., they related their answer to the covariation data). In contrast, most of the younger children did not attend to the evidence at all or they did not interpret it correctly and instead they kept their initial belief.
Although this finding seems to suggest some severe deficits in data interpretation skills and an insufficient differentiation between hypothesis and evidence in young children, more recent research shows that children as young as six-year olds possess a basic understanding of the hypothesis-evidence relation (e.g. Ruffman, Perner, Olson & Doherty, 1993). For instance, Koerber, Sodian, Thoermer, and Nett (2005) found that children as young as five-year-olds are able to successfully interpret simple patterns of covariation data, without any distortion of prior beliefs, when data are not overly complex and when the prior belief is not too strong. In their study, Koerber and colleagues presented children with a hypothesis held by a story character and a set of covariation data (perfect and imperfect covariations, noncovariation) that contradicted the protagonist’s hypothesis. Most five-year-olds successfully attributed a belief revision to the protagonist when the relation presented in the data was straightforward (perfect covariation), showing that they are able to successfully interpret simple patterns of data without any distortions and to incorporate this new evidence into their theories (see also Piekny & Maehler, 2013; van der Graaf, Segers, & Verhoeven, 2016, for a replication of these findings). These confirmatory findings of early data interpretation skills are in line with a growing literature on early preschool and primary school scientific thinking, which shows that already young children possess a basic understanding of the distinction between hypothesis and evidence (Mayer, Koerber, Sodian & Schwippert, 2014; Sandoval, Sodian, Koerber, & Wong, 2014). The discovery of increasingly mature scientific thinking skills in this young age group suggests that children, in principle, should be able to use data and evidence to update and revise their initially held beliefs.
But then why do studies find such weak performance in belief revision tasks in young children? We argue that one of the main reasons why evidence evaluation often fails to promote belief revision in young children is that many studies use evidence that is either too complex and/or is not salient enough, especially so for young children. Asking children to interpret data about the effects of multiple variables in a single design, as for instance was done in Kuhn et al. (1988), places heavy demands on children’s general information-processing capacities and it demands a sequential processing of information. In addition the information typically only enters via a single perceptual route (i.e., data are presented only verbally without graphical depiction). Chinn and Malhotra (2002) found that indeed children find it difficult to make correct, undistorted observations of (counter)evidence when the data are not salient. Data with little salience increased children’s reluctance to change their prior belief in the face of new evidence, showing that the salience of the evidence is an important facilitator of successful belief revision.
One possible way to increase salience of data lies in the presentation of evidence in simple bar graphs. Bar graphs make possible a salient and meaningful representation of covariation data and even preschoolers can successfully interpret these graphs (Koerber & Sodian, 2008). Their positive effects are, such as those of many well-designed visual displays, mostly attributed to the following three characteristics (e.g. Hegarty, 2011; Kosslyn, 1989, 1994, 2006; Larkin & Simon, 1987): First, bar graphs serve as external storage for information and thus they reduce memory capacity. Second, the relations between two variables are spatially organized in bar graphs and they can be perceived at a glance (i.e., different pieces of information and relations between variables can be perceived simultaneously and thus bar graphs allow for a more efficient processing of information). And third, complex cognitive processes can be “offloaded” on perception in bar graphs. Taken together, bar graphs thus assist information processing by offering an additional perceptual route (in addition to the verbal route) and, in addition, their two-dimensional display of a relation between two variables allows using analogies to space and spatial relations in order to make inferences on non-spatial content domains. Graphs thus offer the viewer information (e.g., a linear trend) in a direct way which does not require that this information is inferred or computed from numerical or verbal data. Recent research has shown that the positive effects of bar graphs even hold for children as young as six-year-olds. Moreover, prior research showed that kindergarteners can successfully read off causal relations from simple bar graphs (Koerber & Sodian, 2008).
The present study investigates whether successful belief revision can be induced in young children when evidence is presented in a salient way (i.e., in a bar graph) that requires reduced information processing. Specifically, we compare this way of inducing belief revision to a highly effective means of revising initially held beliefs, which is providing children with explanations and causal mechanisms that link the two variables. This approach has been taken by Koslowski (1996, 2012, see also Koslowski, Marasia, Chelenza, & Dublin, 2008), who argues that children often do not give up their initially held beliefs in favor of contrary evidence because of their strong subjective causal theories. These causal theories comprise not only information about the statistical association (covariation) between two variables, but they also entail beliefs about the underlying causal mechanism that connects the two variables. According to this account, covariation evidence alone cannot sufficiently challenge the initially held beliefs when no adequate, novel explanations about the underlying causal mechanism is offered simultaneously. In a study involving sixth- and ninth- graders as well as college students, Koslowski (1996) presented participants with the results of a fictitious study that investigated whether two kinds of food (sweets with low or high concentration of sugar, and milk with low or high concentration of fat) influenced whether or not children could easily fall asleep. All participants initially believed that sugar but not fat had a significant influence on children’s ability to find sleep. Participants were assigned to two conditions: In one condition, participants received only covariation evidence that contradicted their initially held belief (“covariation-only-condition”); in the other condition, participants received not only covariation evidence, but also they were given an explanation concerning the mechanism that may link fat to sleep (“covariation-and-mechanism condition”). As hypothesized, receiving an additional explanation led to significant more belief revision than did the covariation-evidence alone.
The explanation condition that was included in the present study therefore presented, analogously to Koslowski (1996), children with an explanation that accounted for the occurrence of the counterevidence and a mechanism that linked the two variables. The diagram condition in turn, presented empirical data about covariation in a salient way, depicted in bar graphs. Participants were preschool and primary-school children, who are at an age when conceptual change occurs over a wide range of knowledge areas. We hypothesized that children in this young age group would change their prior belief when presented with evidence in a salient way. In addition, we hypothesized that belief revision would, in the diagram condition, not be inferior to belief revision in the explanation condition.
A 2 (condition: explanation vs. diagram) by 2 (age group: preschoolers vs. second-graders) between-subjects design was employed to investigate children’s belief revision in four tasks.
Participants were 134 children, among them 54 preschoolers (M = 5,6 years, SD = 5 months, nexplanation = 28, ndiagram = 26) and 80 second-graders (M = 7,6 years, SD = 5 months, nexplanation = 40, ndiagram = 40). The 64 girls and 70 boys were sampled from 10 middle-class preschools and schools in a proximity to a large city in southern Germany. Preschools and schools supplied parents with information material about the study, and parents decided whether or not their children would be allowed to participate in the study. In addition to parental informed consent, child assent was obtained for all participants. Participants from both age groups were semi-randomly assigned to one of the two conditions to ensure equal group sizes.
Four tasks were used to test children’s belief revision. The contexts used in these tasks were contexts in which children typically hold strong, naïve beliefs about the covariation and causal relation between two variables. These were: (1) Eating carrots (but not spinach) improves vision; (2) drinking milk (but not mineral water) increases bone density; (3) eating gummi bears (but not mustard) makes you fat; and (4) eating chocolate (but not bananas) makes you happy. For each context, the children were first asked about their initial belief concerning the relation between the variables (e.g. “Does eating carrots or eating spinach improve vision, or do they both equally contribute to good vision?”). Children’s answers were visually displayed by placing small plastic cards (e.g., eyes and carrots) in front of them. This was done so that children would remember their initial belief. Also, children indicated how confident they were about their initial belief (0, 1, 2).
In addition, children were presented with a story protagonist (Robbie or Anna, depending on the gender of the child which was the same for the protagonist) who held the same initial belief as the child. This was done in order to account for potential differences between children’s own belief revision and the revision they ascribe to another person.
Depending on children’s initial belief, the following counterevidence was used to induce belief revision in children: In the carrot/spinach context (task 1), children who believed that carrots or spinach improved vision were presented with counterevidence that showed that the effect of the two variables is equally strong (noncovariation). Children who initially believed that both factors are equally associated with good vision were presented with counterevidence that showed that carrots improve vision (see Table 1 for an overview of which counterevidence was presented in response to varying initial beliefs). Because the prior literature revealed that the type of covariation evidence (e.g., perfect covariation or noncovariation) influences preschoolers’ interpretation of data (e.g., Koerber et al., 2005, Piekny & Mähler, 2013), we included counterevidence in the form of noncovariation as well as in the form of perfect covariation in order to account for potential effects.
Table 1
Design of the four tasks
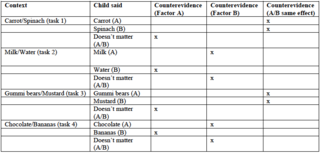
In the diagram condition, counterevidence was presented visually in bar graphs (for an example, see Figure 1); in the explanation condition, experimenters presented the children with an explanation about a mechanism that supported the opposite of children’s initial belief. In the carrots/spinach context, for instance, children who initially believed that only carrots would improve vision heard an explanation that maintained that spinach and carrots contain equal amounts of vitamin A, which is the mechanism that improves vision.
After the evidence was presented, experimenters reminded children of their initial belief. Subsequently, they asked the children about their present belief (including the strength of their confidence in this belief) as well as about the present belief of the story protagonist (third person). Children were interviewed individually by two research assistants, who were extensively trained and who each interviewed equal amounts of children in each condition and age group (i.e., there was no interaction between experimenters and condition). To ensure that children in the diagram condition were able to interpret the bar graphs, a short introduction was given in which the experimenters explained how to read a bar graph.
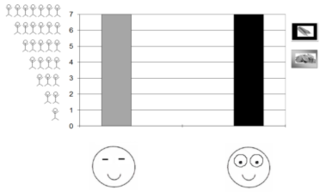
Figure 1. Example of a bar graph (perfect covariation).
Preanalyses revealed that children’s confidence in their initial belief [low (=0), moderate (=1) or high (=2)] was high before treatment (M = 1.59; SD =.44 and M = 1.63, SD = .38, respectively, for the preschoolers and second-graders) with no significant difference between the age groups, t(132) =-.547, p>.05. This clearly indicates that all children held strong initial beliefs.
Figure 2 shows the mean percent of belief revision across all four tasks. In line with our hypothesis, more than 60% of all children changed their initial belief in light of the salient evidence or the explanations. In the explanation condition, between 63% and 71% of all children changed their initial belief (solid lines) and they ascribed a belief revision to the story protagonist (dashed lines) in the light of the counterevidence. In the diagram condition, belief revision was more pronounced in both measures for the second-graders (84% and 86%) than for the preschoolers (59% and 67%). The difference between the diagram condition and the explanation condition was significant in second grade, where children significantly more often changed their own initial belief, t(78)=2.68, p <.01, and significantly more often ascribed a belief revision to the story protagonist, t(78) = 3.44, p=.001, in the diagram condition than in the explanation condition. In the diagram condition, there was, in addition, a significant difference between the two age groups, with five-year-olds changing their initial belief significantly less often than eight-year-olds, t(64) =-4.67, p<.001, and also they ascribed significantly less often a belief revision to the story protagonist than did eight-year-olds, t(64) =–2.63, p=.01. While a 2 (age) by 2 (condition) analysis of variance of children’s mean number of belief revisions ascribed to the story protagonist revealed no significant main effects for age (F(1, 129) = 1.282, ns) or condition (F(1, 129) = 2.590, ns) a significant interaction, F(1, 129) = 5.631, p < .05, η2 = .042 was revealed.

Figure 2. Mean number of belief revisions categorized by age and condition
Can successful belief revision be induced in young children when evidence is presented in a salient way? The present study found that salient evidence (diagrams) is as effective to challenge and revise young children’s initial beliefs as explanations. In contrast to the findings of a large number of prior studies (e.g., Amsel & Brock, 1996; Chinn & Brewer, 1993), our findings suggest that even preschoolers are able to revise an initial belief when they are presented with counterevidence, be it an explanation about a mechanism or covariation evidence in a salient way. Second-graders showed even more belief revision when presented with salient counterevidence (bar graph) than when receiving an explanation, suggesting that this form of evidence presentation may be especially beneficial in this age group.
In accordance with our hypothesis, bar graphs helped children to successfully interpret the data and to revise their initial beliefs. Bar graphs appear to be such a helpful tool in belief revision because they depict the relation between two or more variables in a straightforward manner; in addition, they enable students to grasp complex data patterns that depict the relations between multiple variables at a single glance, and they help to reduce memory and information processing demands. This way, bar graphs make the counterevidence more salient, and by means of this saliency they lead to substantially higher rates of belief revision than have been found in prior studies (e.g., Amsel & Brock, 1996).
Interestingly, our second graders performed even better in the diagram condition than in the explanation condition. This is an interesting finding because research from Koslowski (1996) has shown highly beneficial effects of explanations in belief revision. A possible explanation for this finding (the high amount of belief revision in the diagram condition) is that children may have come up with self-generated explanations (Legare, 2012). These self-generated explanations may have supported and strengthened the effect of the diagrams. Legare showed that two- to six-year-olds produce substantially more often self-generated explanations when they are faced with counterevidence than when they interpret evidence that is consistent with their initial beliefs.
Importantly, our participants did not seem to distort the data in the diagram condition. This is most likely due to the salience of the counterevidence that we presented in the bar graphs, which makes it difficult to ignore or neglect aspects of the data that do not align with children’s initial beliefs. Visually perceiving counterevidence thus might have triggered children to generate their own, new explanations for the unexpected relation rather than distorting the data. And it is reasonable to assume that these self-generated explanations are even more beneficial for inducing belief revision than those generated by another person.
Given this interpretation, it might be that the better performance of the second graders in the diagram condition cannot only be attributed to their perception of the visual information but also to their deeper processing of the information. Future studies therefore need to disentangle the impact of the visual salience of the counterevidence and the depth of processing of the information (e.g., the generation of self-explanations). To this end, “thinking aloud” protocols in which participants are explicitly asked to come up with explanations may be especially helpful. If the salient presentation of evidence and diagrams indeed provoke self-generated explanations, then it is impossible to strictly isolate the effects of the presentation of the diagram and the explanations. Thus, in line with Koslowski (1996, 2012), we did not regard evidence and explanation as a dichotomy, but rather we suggest that future studies should investigate the way in which the salient presentation of evidences leads to the generation of theory-based explanations. Adding a third, mixed condition, in which the participants receive counterevidence and explanations, should then be equally facilitating for belief revision as the diagrams alone.
Children’s own belief revision was contrasted in this study with their ascription of belief revision to another person. Although we found convergent findings in these two measures, the difference between the diagram and the explanation condition was more pronounced in second grade when asking children about another person’s belief revision. The belief revision of a third person has been the dependent measure in many other studies (e.g., Koerber et al, 2005; Piekny & Mähler, 2013), which is typically done because it ensures that the (counter)evidence is evaluated from a more abstract and distant level. The general trends in our data were however similar for our two measures (own belief revision and belief revision ascribed to a third person) so that it seems reasonable to assume that these two measures are closely related, leading to the same conclusions regarding the influence of saliency on evidence interpretation.
In sum, our findings suggest that the salient presentation of counterevidence leads to belief revision in children as young as five-year-olds. Although explanations are important for children’s belief revision, explanations do not need to be provided externally (e.g., by an adult); instead, our data show that presenting evidence may suffice when it is presented in a way that is salient and that may elicit children’s self-generation of explanations. If this interpretation of our findings holds and children indeed generate explanations while processing salient evidence, this finding will be of high relevance not only for theorists, but also for teachers and practitioners in schools. First, it underlines the important role diagrams can play for illustrating concepts. Second, it also reveals their usefulness for eliciting and promoting conceptual change (see also Koerber, 2003). Therefore, diagrams should play a more important role in school in general and specifically in science and math curricula.
The study was conducted as part of the project “Development of understanding graphs and diagrams in preschool age and elementary-school age” and it was funded by the German Research Council (DFG) (KO 2276/3-1).We would like to thank Daniela Huber and Susanne Mikschl for their assistance in data collection and all children, parents, and teachers who supported this study.
Amsel, E., & Brock, S. (1996). The development of evidence
evaluation skills. Cognitive Development, 11,
523-550. http://dx.doi.org/10.1016/S0885-2014(96)90016-7
Chinn, C. A., & Brewer, W. F. (1993). The role of anomalous
data in knowledge acquisition: A theoretical framework and
implications for science instruction. Review of Educational
Research, 63, 1-49.
Chinn, C. A., & Malhotra, B. A. (2002). Children's responses
to anomalous scientific data: How is conceptual change impeded? Journal
of Educational Psychology, 94, 327-343.
http://dx.doi.org/10.1037/0022-0663.94.2.327
Croker, S., & Buchanan, H. (2011). Scientific reasoning in a
real‐world context: The effect of prior belief and outcome on
children's hypothesis‐testing strategies. British Journal of
Developmental Psychology, 29(3), 409-424. DOI:
10.1348/026151010X496906
Hegarty, M. (2011). The cognitive science of visual-spatial
displays: implications for design. Topics in Cognitive
Science, 3(3), 446–474. DOI:
10.1111/j.1756-8765.2011.01150.x
Klaczynski, P. A. (2001). Analytic and heuristic processing
influences on adolescent reasoning and decision‐making. Child
Development, 72, 844-861. DOI:
10.1111/1467-8624.00319
Koerber, S. (2003). Der Einfluss externer Repräs entationsformen
auf proportionales Denken im Grundschulalter. [ The
influence of external forms of representation on proportional
reasoning in elementary school age. ] Hamburg:
Verlag Dr. Kovac.
Koerber, S., Sodian, B., Thoermer, C., & Nett, U. (2005).
Scientific reasoning in young children. Preschoolers’ ability to
evaluate covariation evidence. Swiss Journal of Psychology,
64, 141-152.
http://dx.doi.org/10.1024/1421-0185.64.3.141
Koerber, S., & Sodian, B. (2008). Preschool children’s ability
to visually represent relations. Developmental Science, 11,
390-395. DOI: 10.1111/j.1467-7687.2008.00683.x
Kosslyn, S. M. (1989). Understanding charts & graphs. Applied
Cognitive Psychology, 3, 185–226. DOI:
10.1002/acp.2350030302
Kosslyn, S. M. (1994). Elements of graph design. New York: W. H.
Freeman.
Kosslyn, S. M. (2006). Graph design for the eye and mind. New
York: Oxford University Press
Koslowski, B. (1996). Theory and evidence: The development of
scientific reasoning. MIT Press.
Koslowski, B. (2012). Scientific reasoning: Explanation,
confirmation bias and scientific practice. In G. Feist & M.
Gorman (Eds.), Handbook of the Psychology of Science and
Technology (pp 151-192). Dordrecht: Springer.
Koslowski, B., Marasia, J., Chelenza, M., & Dublin, R. (2008).
Information becomes evidence when an explanation can incorporate
it into a causal framework. Cognitive Development, 23(4),
472-487. http://dx.doi.org/10.1016/j.cogdev.2008.09.007
Kuhn, D. (2010). What is scientific thinking and how does it
develop? In U. Goswami (Ed.). Handbook of Childhood Cognitive
Development (2 nd ed., pp. 472-534). Oxford,
England. Blackwell.
Kuhn, D., Amsel, E., & O'Loughlin, M. (1988). The development
of scientific reasoning skills. Orlando, CA: Academic.
Larkin, J., & Simon, H. (1987).
Why a diagram is (sometimes) worth ten thousand words.
Cognitive Science, 11,
65 –99. DOI:
10.1111/j.1551-6708.1987.tb00863.x
Legare, C. H. (2012). Exploring explanation: Explaining
inconsistent evidence informs exploratory, hypothesis‐testing
behavior in young children. Child Development, 83,
173-185. DOI: 10.1111/j.1467-8624.2011.01691.x
Masnick, A. M., Klahr, D., & Knowles, E. R. (2016).
Data-driven belief revision in children and adults. Journal
of Cognition and Development, (just-accepted).
http://dx.doi.org/10.1080/15248372.2016.1168824
Mayer, D., Sodian, B., Koerber, S., & Schwippert, K. (2014).
Scientific reasoning in elementary school children: Assessment and
relations with cognitive abilities. Learning and Instruction,
29, 43-55.
http://dx.doi.org/10.1016/j.learninstruc.2013.07.005
Piekny, J., & Maehler, C. (2013). Scientific reasoning in
early and middle childhood: The development of domain‐general
evidence evaluation, experimentation, and hypothesis generation
skills. British Journal of Developmental Psychology, 31(2),
153-179. DOI: 10.1111/j.2044-835X.2012.02082.x
Ruffman, T., Perner, J., Olson, D. R., & Doherty, M. (1993).
Reflecting on scientific thinking: Children's understanding of the
hypothesis‐evidence relation. Child Development, 64,
1617-1636. DOI: 10.1111/j.1467-8624.1993.tb04203.x
Sandoval, W. A., Sodian, B., Koerber, S., & Wong, J. (2014).
Developing children's early competencies to engage with science. Educational
Psychologist, 49, 139-152.
http://dx.doi.org/10.1080/00461520.2014.917589
van der Graaf, J., Segers, E., & Verhoeven, L. (2016).
Scientific reasoning in kindergarten: Cognitive factors in
experimentation and evidence evaluation. Learning and
Individual Differences, 49, 190-200.
http://dx.doi.org/10.1016/j.lindif.2016.06.006