![]()
Frontline Learning Research Vol.4 No. 5 (2016) 34
- 61
ISSN 2295-3159
Vrije Universiteit Amsterdam, the
Netherlands
Article received 3 March / revised 30 May / accepted 13 October / available online 15 December
Non-routine word problem solving is an essential feature of the mathematical development of elementary school students worldwide. Many students experience difficulties in solving these problems due to erroneous problem comprehension. These difficulties could be alleviated by instructing students how to use visual representations that clarify the problem structure and the relations between solution-relevant elements (so-called visual-schematic representations). Research shows that instructional effectiveness depends largely on teachers’ mathematical knowledge for teaching. Teachers’ knowledge of visual representations is therefore essential to instructing word problem comprehension in this way. As there is little to no literature investigating teachers’ practices in this area, the goal of the present study is to examine teachers’ use of visual representations to support non-routine word problem solving. Eight mainstream elementary school teachers implemented an innovative approach focused on the use of visual-schematic representations. After a short training, teachers were able to produce these representations during instruction. However, some teachers seemed unclear about what these representations comprise and what function they serve within the word problem solving context. Teachers seemed to base their use of representations on personal preferences rather than on an optimal fit with the word problem characteristics. These aspects need to be addressed in teacher training and professional development programs. This study makes an unique contribution to research in the important and problematic area of word problem solving in regular classrooms. The results of this study are relevant for educational researcher, teachers, and teacher educators who deal with difficulties in instructing mathematical word problems.
Keywords: word problem solving instruction; visual representations; teacher modelling; mathematical knowledge for teaching
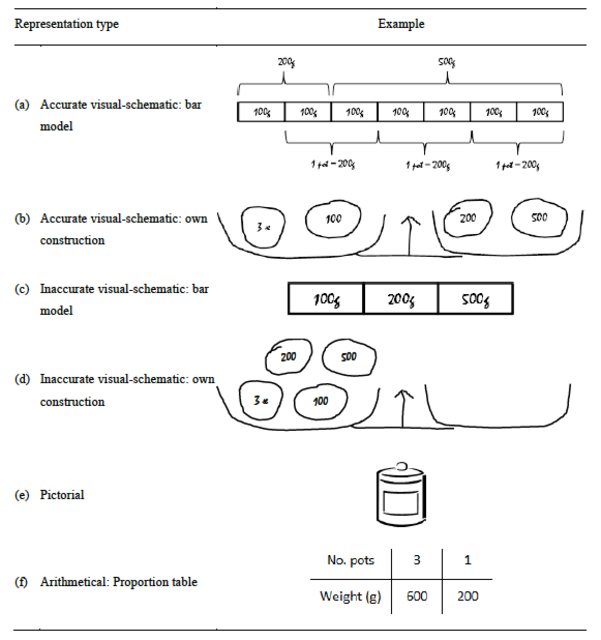
On one side of a scale there are three pots of jam and a 100g weight. On the other side there are a 200g and a 500g weight. The scale is balanced. What is the weight of a pot of jam?
In contemporary math education, word problems like this are frequently offered to students. Learning to solve these so-called non-routine word problems is an essential feature of mathematical development (Depaepe, De Corte, & Verschaffel, 2010; Jiminéz & Verschaffel, 2014; Swanson, Lussier, & Orosco, 2013). In this study, non-routine word problems are defined as challenging problems set in realistic contexts, that require understanding, analysis and interpretation. They are not simple computational tasks embedded in words; they require an appropriate selection of strategies and decisions that lead to a logical solution (Van Garderen & Montague, 2003).
Students’ difficulties in solving non-routine word problems are common in contemporary math classrooms (Boonen, Van der Schoot, Van Wesel, De Vries, & Jolles, 2013; Hegarty & Kozhevnikov, 1999; Krawec, 2010; Van Garderen & Montague, 2003) and are widely recognized by both teachers and mathematics education researchers (Boonen, Van Wesel, Jolles, & Van der Schoot, 2014; Prenger, 2005; Van Garderen, 2006; Van Garderen & Montague, 2003). Several instructional programs, for example cognitive strategy instruction, have been developed that provide support in word problem solving for low-performing students (see Jitendra, 2002; Jitendra et al., 2013; Montague, 2003; Montague, Warger, & Morgan, 2000). These programs have often been used in research settings involving researchers working with individuals or small groups. However, also instructional programs that are implemented in mainstream classrooms are developed and tested (e.g., Boonen & Jolles, 2015; Csíkos, Szitányi, & Kelemen, 2012; Verschaffel, De Corte, Van Vaerenbergh, Lasure, Bogaerts & Ratinckx, 1999; Willis & Fuson, 1988). In the study of Verschaffel et al., (1999), for example, a learning environment for teaching and learning how to model and solve mathematical word problems was developed and tested in four mainstream classrooms of 5th grade students. This is important, given that mainstream schools in many countries are becoming more inclusive, with greater numbers of students with mild to severe learning difficulties in classrooms (Jitendra & Star, 2012; Sharma, Loreman, & Forlin, 2012). Dutch mainstream elementary school teachers, for example, report on average a quarter of their students as having special educational needs (Van der Veen, Smeets, & Derriks 2010). It would therefore be of benefit to teachers if they had instructional approaches at their disposal designed to support learning in areas that many students find difficult - in this case, non-routine word problem solving.
So, contrary to previous studies that are implemented in mainstream classrooms, the present study is not focused on student modelling and solving mathematical word problems (i.e., Csíkos et all., 2012; Verschaffel et al., 1999) but examines how teachers implement an innovative approach to instructing word problem solving - based on the use of visual representations - during whole-class teaching in mainstream sixth grade classrooms. In sixth grade, students are expected to be able to solve a wide variety of non-routine problems of increasing difficulty. The challenge in enabling students to tackle such problems is considerable, so instructional support at this grade level is particularly appropriate.
Non-routine word problems cannot be solved using any fixed algorithm or set of prescribed procedures (Elia, Van den Heuvel-Panhuizen, & Kovolou, 2009; Pantziara, Gagatsis, & Elia, 2009). In other words, in non-routine word problem solving there is no convenient model or solution path that is readily available to apply to solving a problem.
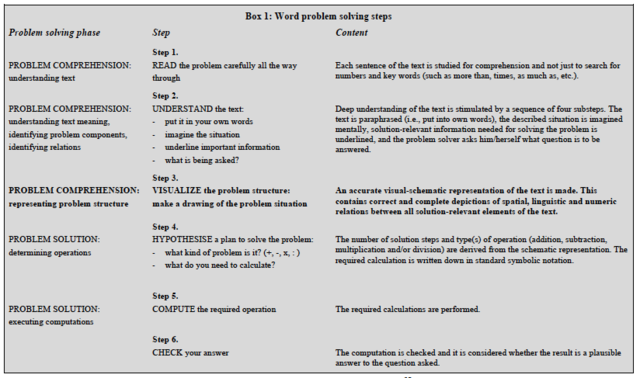
According to Verschaffel, Greer and De Corte (2000), solving word problems in general involves several phases, starting with understanding the situation that is described in the word problem and forming a situation model. The first phase concerns (1) reading the word problem; (2) understanding the problem text; and (3) make a complete and coherent representation of the situation described in the problem. The next phase involves mathematizing, i.e., translating the situation model into mathematical form by (4) identifying the relevant numerical and linguistic components; (5) identifying the relationships between these components; and (6) expressing these by mathematical equations. The last three phases of the word problem solving process are (7) executing the mathematical equations; (8) interpret the outcome and formulate an answer; and (9) evaluate the solution (Krawec, 2010; Lewis & Mayer, 1987; Verschaffel et al., 2000). Although this study is particularly interested in making a complete and coherent representation of the situation described in the problem of a word problem, which is the first phase in the word problem solving process, all the other phases described in Verschaffel et al. (2000) are taken into account in the teaching intervention that is implemented. Altogether, solving non-routine word problems thus involves carrying out and integrating several cognitive activities that involve a non-trivial amount of related information.
Research shows that the difficulties experienced by many students in solving word problems arise not from their inability to execute computations, but from difficulties in understanding the problem text, identifying solution-relevant components and the relations between them, and making a complete and coherent representation of the situation described in the problem (Boonen et al., 2013; Carpenter, Corbitt, Kepner, Lindquist, & Reys, 1981; Cummins, Kintsch, Reusser & Weimer, 1988; Krawec, 2010; Lewis & Mayer, 1987). Hence, erroneous word problem solutions are frequently a consequence of errors in the problem comprehension phase rather than in the problem solution phase.
From the perspective presented above, providing support for the problem comprehension phase should be particularly beneficial to students’ problem solving performance. Yet, based on our observations in educational practice, word problem solving in the classroom as well as teacher training often focuses on the solution phase. Existing research-based programs to support word problem solving of low performing students incorporate both problem solving phases in the form of prescribed cognitive strategies (i.e., reading and understanding the problem, analyzing the information presented, developing logical solution plans, evaluating solutions) presented in a sequence of steps (Jitendra & Star, 2012; Jitendra et al., 2009; Krawec, 2012; Montague et al., 2000).
In these programs, support for the problem comprehension phase typically includes strategies for understanding the problem text (e.g., by paraphrasing the text and underlying relevant information) and strategies for identifying and representing the underlying problem structure by means of a visual representation. The assumption is that a visual representation should clarify the problem structure by making the numerical, linguistic and spatial relations between solution-relevant elements visible, which consequently facilitates understanding of the problem and identification of the computations to be performed (Boonen et al., 2014; Krawec, 2010, 2012). Thus, using visual representations during problem comprehension could be an effective way to support word problem solving (Van Garderen & Montague, 2003).
Two current research-based approaches to using visual representations in the problem comprehension phase can be distinguished. The first is to provide students with specific visual representations for specific types of problem, namely routine word problems (i.e., word problems in which a convenient model or solution path is readily available to apply while solving a problem). In these word problems students are then encouraged to reflect on the similarities and differences between problem types and the corresponding visual representations (Jitendra, Dipipi, & Perron-Jones, 2002; Jitendra & Star, 2012; Jitendra et al., 2009). Although this approach can be successful for teaching students how to tackle routine problems with an identical structure (e.g., ‘compare’ problems as: Mary has 5 marbles. John has 8 marbles. How many more marbles does John have than Mary?), it is usually not possible to match non-routine word problems to a fixed representation type. Teaching students to use only one specific visual representation for each type of problem is, moreover, risky, as it may lead to an inflexible and rigid use of representation strategies (Jitendra, Griffin, Haria, Leh, Adams, & Kaduvettoor, 2007; Van Dijk, Van Oers, & Terwel, 2003; Van Dijk, Van Oers, Terwel, & Van den Eeden, 2003a).
The second approach – typically for non-routine word problems – defines visual representation in general heuristic terms: this should be done either mentally or by making a drawing. Indeed, it is characteristic for non-routine problems that they cannot be represented in a prescribed way; in such conditions, the use of a heuristic approach may seem appropriate. It is a false assumption, however, that students know how to translate such a heuristic into a useful visual representation. Students generally do not know what to draw, when, under which circumstances and for which types of problems (Jitendra et al., 2007; Jitendra et al., 2009).
In summary, there are important shortcomings in current approaches to using visual representations to support comprehension of non-routine word problems. On the one hand, approaches that teach fixed visual representations for problem solving are insufficient to deal with the situation-specific structure of non-routine problems. On the other hand, heuristic approaches do not provide sufficient guidance for students to produce useful visual representations.
These shortcomings could be addressed by teaching students to produce visual representations that accurately depict the situation-specific structure of non-routine word problems. Such representations should present a complete and coherent model of the relations between all solution-relevant problem components. We refer to these as accurate visual-schematic representations. It is important to note that such representations can incorporate standard mathematical models, such as a bar model, pie chart or number line, but that they often comprise freely constructed drawings. Examples of an accurate bar model and ‘own’ construction are shown in Table 1(a) and (b) respectively for the weighing scale problem presented earlier.
Research shows that accurate visual-schematic representations facilitate problem comprehension, help to identify the required calculation processes and thereby contribute to successful problem solving (see e.g., Boonen et al., 2013, 2014; Hegarty & Kozhevnikov, 1999; Van Garderen, 2006; Van Garderen & Montague, 2003). For example, the visual-schematic bar model in Table 1(a) demonstrates that an accurate depiction of problem structure can greatly reduce calculation demands: simply by depicting the given quantities in the correct relation to each other, it can instantly be seen that each pot of jam must weigh 100g + 100g.
This stands in contrast to more commonly known visual representations, namely pictorial and arithmetical representations, both of which frequently accompany word problem solving in mathematical text books. Pictorial representations contain a detailed image of some element of the problem text (e.g., an object or a person) without identifying relations between problem elements or the required calculations (Table 1[e]). These representations have been found to negatively influence the word problem solving process (Boonen et al., 2014; Berends & Van Lieshout, 2009; Hegarty & Kozhevnikov, 1999; Krawec, 2010, 2012; Van Garderen, 2006; Van Garderen & Montague, 2003). Arithmetical representations (e.g., proportion tables, Table 1[f]) are intended to support the calculation processes required to compute answers. This type of representation is generally introduced in the problem solution phase but does not contribute to problem comprehension; thus, when the problem is not well understood, arithmetical representations frequently contain erroneous information and lead to incorrect answers (Boonen et al., 2013; Cummins et al., 1988; Krawec, 2010).
Table 1
Examples of types of visual representation for the weighing
scale problem
Theoretical perspectives on teaching students mathematics increasingly emphasize that teachers must possess adequate ‘mathematical knowledge for teaching’ (MKT), namely the collective mathematical knowledge, skills and attitudes needed to support student learning (Ball, Thames, & Phelps, 2008). This includes both pedagogical content knowledge (knowing a variety of effective ways to present and represent mathematical content, taking account of learner characteristics and common misconceptions and difficulties in learning the subject matter; Shulman, 1987) - as well as specialized mathematical subject matter knowledge a teacher needs to teach particular content.
With respect to visual representations, teachers need to recognize what is involved in using particular representations and when they are appropriate to use (Ball et al., 2008). In the context of the present study, teachers need to be aware that visual-schematic representations should be used to support the first phase of the word problem solving process (i.e., problem comprehension) and that arithmetical representations are only appropriate in the problem solution phase. Moreover, teachers should be able to use multiple representations and link different representations to each other and to underlying ideas (Ball et al., 2008; Dreher & Kuntze, 2015).
Research shows that the effectiveness of teachers’ mathematical instructional practices depends largely on the quality of teachers’ MKT (Ball et al., 2008; Hill et al., 2008). Unfortunately, there is relatively little literature about teachers’ understanding of and competence with visual representations, and we have found no literature that specifically addresses how teachers teach students to construct visual representations to support word problem comprehension. It cannot be assumed that teachers are able to do this; indeed, visual representations are reported to be problematic for teachers. For example, Orrill, Sexton, Lee and Gerde (2008) reported that middle grade mathematics teachers in the US are uncomfortable with visual representations, and that this relates to their incomplete knowledge about using and interpreting such representations. Turner (2008) found that beginning elementary school teachers in the UK frequently have difficulty in choosing and using visual representations (e.g., number lines and hundred squares), and that their choices are based on superficial attractiveness rather than the suitability of the representations for the mathematics they want children to learn. In Germany, Dreher and Kuntze (2015) found that even secondary school mathematics teachers do not fully understand the role and use of different forms of visual representations for learning about and teaching fractions.
In the present case, in which visual representations should be used to support comprehension of non-routine word problems, teachers may not know what kind of representations should be made or in which phase of the problem solving process to use them. Teachers may also have difficulty in constructing visual representations accurately (i.e., correctly and completely). Incorrect and/or incomplete visual-schematic representations are referred to as inaccurate visual-schematic representations (e.g., Table 1[c] and [d]). Furthermore, research shows that it is more effective to teach students to construct their own visual representations than to provide them ready-made, as this contributes to skill adaptivity (Van Dijk et al., 2003; Van Dijk et al., 2003a). Thus, teaching needs to focus on the construction process (i.e., how to make the representation), rather offering a representation as a given entity. Finally, teachers should encourage students to use visual representations in a diverse, adaptive/flexible and functional way. This refers to being able to use different kinds of visual representations and to switch between them such that the representation fits the structural characteristics of the problem and is useful for helping to solve it. Indeed, the ability to deal flexibly with multiple representations and move adaptively between them is seen as being essential for successful mathematical problem solving (e.g., Acevedo Nistal, Van Dooren, Clarebout, Elen & Verschaffel, 2009; Dreher & Kuntze, 2015). However, as noted above, these aspects are frequently problematic for teachers (Dreher & Kuntze, 2015; Orrill et al., 2008; Turner, 2008).
In short, although using accurate visual-schematic representations to support the problem comprehension phase of word problem solving has considerable potential for improving problem solving performance, research is needed that examines how teachers implement an approach centred on the use of these visual representations. It is important to establish this point, as it is critical to the viability of this approach for supporting word problem solving in schools, as well as providing important indications for teacher professionalization programs.
The goal of the present study is to examine teachers’ use of visual representations when implementing a teaching intervention for supporting non-routine word problem solving that focuses on constructing accurate visual-schematic representations. The teaching intervention is embedded within a sequence of problem solving steps (comparable to the programs mentioned above) that reflect the problem solving phases described earlier. It is important to note that, just as both problem solving phases are essential for effective problem solving, so all steps are intended to be carried out fully in the prescribed order for each problem treated.
The general goal of the teaching intervention is to teach students cognitive strategies for solving non-routine word problems. The specific goal is to teach students to construct accurate visual-schematic representations of problem structure and to encourage them to select and use visual representations in a functional (i.e., helpful for solving the problem) and diverse and adaptive/flexible way. Diversity refers to the varied use of visual representations. Adaptivity/flexibility, on the other hand, refers to choosing flexibly between available representations (i.e., teachers’ capability to decide on the representation that is the most appropriate, see Heinze, Star & Verschaffel, 2009). An overview of the steps and the relation of each step to problem solving phase is provided in Box 1 (based on Montague et al., 2000). The key interest of the present study, that is the construction of accurate visual-schematic representations (implemented in the third, i.e., visualization step), is indicated in bold print.
The teaching intervention comprises eight lessons that make use of teacher modelling (i.e., the teacher who acts as the instructor of the intervention thinks aloud while demonstrating a cognitive activity), student modelling (i.e. sixth grade pupils think aloud while demonstrating a cognitive activity under the guidance of their teacher) and independent student practice (see Methods section). We focus on teacher modelling, as teachers’ use of visual representations is expected to be most visible here. An important aspect of the teaching intervention is that teachers are encouraged to implement it in a way that is compatible with their own manner of teaching (Rogers, 2003). This makes it possible to study natural diversity in teachers’ behaviours.
To meet the goals of the present study, the following research
questions are posed:
a. What attention do teachers give to visualization when
implementing the teaching intervention, when do they use visual
representations in the word problem solving process and to what
purpose?
Given the focus of the teaching intervention on the use of visual
representations, teachers are expected to pay most attention to
the visualization step of the problem solving process, to use
visual representations to structure problem elements and the
relations between them, and to embed this within the full sequence
of prescribed steps. However, it is possible that teachers focus
on other parts of the problem solving process, that they use
visual representations at other points of the process and/or for
other purposes (e.g., illustrating unfamiliar words in the text,
calculating answers), or that they do not use visual
representations at all. It is also possible that steps are
omitted, combined or performed out of order, which may result in
the visualization step not being embedded in the prescribed
sequence as intended.
b. What kinds of visual representations do teachers use and how diverse and adaptive/flexible is this use of visual representations? Teachers are expected to demonstrate a varied use of visual representations (i.e., diversity) and to offer different kinds of representations for solving a problem (i.e., adaptivity/flexibility). However, it is possible that teachers use representations in a limited and fixed way and/or that they do not consider different ways of representing problems.
c. What is the quality of the representation process and of the visual representations used? Teachers are expected to model the representation process transparently, correctly and completely. However, it is possible that teachers do not make their reasoning transparent (e.g., offering a visual representation without explaining which elements of the problem should be represented or without explaining how the representation can be used to solve the problem), and/or that their reasoning is incorrect (e.g., naming and/or using visual representations wrongly) and/or incomplete (e.g., naming a visual representation that can be used but not indicating why). Teachers are also expected to construct visual representations that correctly and completely depict the relations between all solution-relevant problem components. However, the visual representations made could be incorrect (i.e., containing erroneous problem components or relations) and/or incomplete (i.e., missing components and/or relations). The visual representations used are also expected to be suitable and useful (i.e., functional) for solving the problem. However, it is possible that visual representations do not fit problem characteristics well (e.g., a number line for solving a problem about percentages) and/or that they contain excess information that is not relevant for and could interfere with solving the problem.
The present research is performed within the context of a teaching intervention for supporting non-routine word problem solving that involved eight mainstream teachers recruited through purposive sampling. These teachers had a positive attitude towards mathematics, were confident about teaching mathematics and using visual representations, and were motivated to participate in and contribute to research in this area. It is well established that a lack of motivation and interest can severely impact the way in which teachers implement educational innovations in regular classrooms. The personal willingness of teachers to adopt and integrate innovations into their classroom practice is of crucial importance (Evers, Brouwers, & Tomic, 2002; Ghaith & Yaghi, 1997; Hermans, Tondeur, Van Braak, & Valcke, 2008; Rogers, 2003). Thus, by limiting participation to individuals with these qualities, results are obtained under favourable conditions in which teacher behaviour is not negatively influenced by motivational factors. This allows behaviours to be analysed on the basis of the specified criteria, with known affective confounders excluded.
As far as we know, this is the first study to focus on mainstream teachers’ use of visual-schematic representations in whole class word problem solving instruction. The study thus makes a unique contribution to research in the area of word problem solving, as well as to literature on teachers’ understanding of and competence with visual representations. Insights in these areas are important for improving instructional support and teacher training, given the relation between teachers’ MKT and instructional effectiveness (Ball et al., 2008) together with the emphasis on word problem solving and the use of visual representations stated in the mathematics curricula of many countries and international assessments (e.g., Department for Education, 2013; Mullis & Martin, 2013; NCTM, 2000; Noteboom, 2009; OECD, 2013).
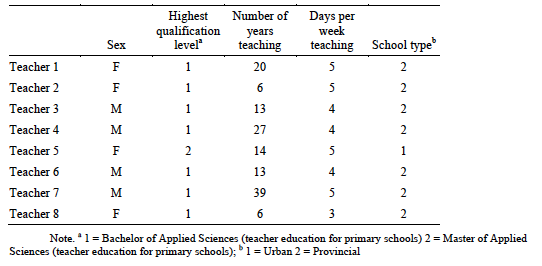
Directors of elementary schools in the central provinces of the Netherlands were approached with information about the teaching intervention and a request to participate in this research. Eight mainstream sixth grade teachers from four schools subsequently volunteered to participate. These teachers indicated that they were motivated to implement the teaching intervention and contribute to this research, that they had a positive attitude towards mathematics, that they were confident about teaching mathematics and that they believed themselves to be competent in using visual representations in the math lesson. Table 2 presents the background characteristics of the participating teachers.
Table 2
Background characteristics of participating teachers
Parents of students in the classes of the participating teachers were informed that their child would participate in the study and that they could withhold permission for their child to participate. No parents took up this option; thus, all participating classes were intact.
Three weeks prior to commencement of the teaching intervention, teachers attended one afternoon session of 60 minutes that presented the aims and rationale of the study and introduced the intervention. The purpose of a second afternoon session of 120 minutes two weeks later was to reveal how to execute the problem solving steps. Both training sessions were facilitated by one of the researchers who executed the research. Professional development materials that were presented during the second afternoon session contained: (a) an overview of the most important national and international literature regarding word problem solving and word problem solving instruction; (b) a presentation and explanation of each of the problem solving steps; (c) a description of how to perform each step on the basis of several examples. Furthermore, teachers received an elaborated lesson protocol that contained a fully scripted model of how to apply the steps for each word problem to be treated. The problems were obtained from regular math textbooks and were fully authentic. Rather than use the scripts verbatim, however, teachers were encouraged to use their own explanations and elaborations during the intervention and to implement it in a way that was compatible with their own teaching approach.
The eight lessons of the teaching intervention were subsequently delivered by all participating teachers over the course of four weeks, with two lessons of 40 minutes duration per week. These lessons replaced regular lessons within the standard math curriculum. On-going assistance from the research team was available throughout the study duration. Each student in the class of a participating teacher received a textbook with the problems to be treated, an exercise book and a prompt card that depicted the problem solving steps in a visually attractive way.
The first four lessons made use of teacher modelling. In these lessons, three to six word problems were intended to be modelled by the teacher, with 22 problems to be modelled in total. Twenty of the teacher modelled problems were selected for analysis. The selection of these problems was based on the following criteria: the 20 problems were non-routine word problems which required two or more solution steps and could not be solved using a fixed algorithmic method (see Appendix I for some examples of the word problems modelled by the teachers) . It should be noted that for all word problems more than one form visual representation could be made. The two problems that were excluded were not representative of the types of non-routine problems with which students have difficulties as they required only one solution step and could be solved using a fixed algorithmic method.
The last four lessons made use of student modelling followed by independent student practice. Instructional support was gradually faded out within and across lessons so that students could ultimately take control of their own problem solving work.
The complete teaching intervention (i.e., 8 lessons) was recorded on video for each of the participating teachers. All recordings of the first four lessons (i.e., in which teacher modelling took place) were subsequently viewed by two members of the research team, and the way in which the teacher modelled the problem solving steps (see Box 1) for each of the selected problems was recorded, described and coded according to the measurement and analysis scheme presented in the following paragraphs. Inter-rater reliability of the coding was computed as Krippendorff’s alpha coefficient for nominal (here, dichotomous) and ordinal data. The obtained coefficients for nominal variables ranged from .86 to 1.00 and for ordinal variables from .91 to .98, indicating high reliability (Krippendorff, 2004).
2.3.1 RQ1 (attention to visual representations, usage and purpose)
For each teacher-modelled problem and for each problem solving step, it was recorded: (1) whether and when the teacher performed the step; (2) step duration in minutes; (3) whether the teacher used a visual representation during the step; (4) for what purpose the visual representation was used; (5) any other factors (e.g., lesson or class management) impacting teachers’ attention to or use of visualization. Where steps were combined (i.e., performed simultaneously as opposed to sequentially), the time spent on the combination was allocated in equal proportions to each of the constituent steps. The total time spent on each step by each teacher across all teacher-modelled problems was then calculated, giving an indication of the attention given to each step and consequently the relative attention given to visualization compared to the other steps. Next, the data from (1), (3), (4) and (5) above were reviewed and discussed by two members of the research team. This resulted in the identification of patterns specifying when visual representations were used during the problem solving process and to what purpose.
2.3.2 RQ2 (kinds of visual representations used, diversity and adaptivity/flexibility)
Teachers’ behaviours relevant to their use of different types and forms of representations were recorded. For each visual representation used, the type of representation (i.e., pictorial, arithmetical, visual-schematic) and form of representation (i.e., bar model, pie chart, number line, proportion table, own construction (i.e., a freely constructed drawing, see Table 1 [b] and [d]) was recorded; more than one representation could be recorded per problem, if applicable. For each teacher, the following measures were then derived from these data:
2.3.3 RQ3 (quality of representation processes and representations) Teachers’ behaviours relevant to the quality of their representation processes and representations were recorded. For each arithmetical and visual-schematic representation used, the quality of the representation process was rated in terms of:
For each arithmetical and visual-schematic representation used, the quality of the representation itself was rated in terms of:
On the basis of these data, the average transparency rating, percent correct and complete representation processes, average functionality rating and percent correct and complete representations were then calculated for each teacher across all arithmetical and visual-schematic representations he/she used. Note that, although pictorial representations were recorded, measures of diversity, flexibility, functionality and quality of the representation process and representation were not reported for this representation type. The production of pictorial representations was, after all, not the main focus of the teaching intervention that had to implemented by the teachers.
Although teachers were trained to perform each of the problem solving steps in the prescribed order for each problem, none of them consistently followed the full sequence of steps. All teachers occasionally omitted steps completely (often the HYPOTHESISE and CHECK steps) or partially (particularly paraphrasing the text and imagining the specific situation described therein). Furthermore, teachers frequently concatenated steps, often combining VISUALIZE with the UNDERSTAND and/or COMPUTE step. The consequences of this for teachers’ use of visual representations are examined later.
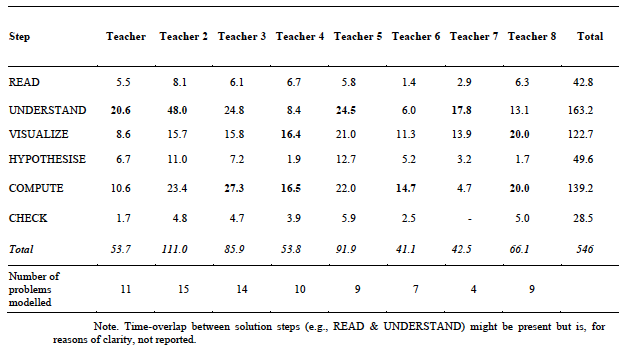
Table 3 presents the time allocation for each teacher and each step across all teacher-modelled problems. Note that teachers did not spend equivalent amounts of time on modelling (range = 41-111 minutes) and did not model the same number of problems (range 4-15). All but two teachers frequently solicited student input during the modelling process and engaged in extensive interaction with students, particularly during the UNDERSTAND, VISUALIZE and COMPUTE steps. Consequently, most time was spent on these steps.
It can be seen that four of the eight teachers spent the most time on understanding the problem text (UNDERSTAND), two on both visualising the problem structure (VISUALIZE) and calculating answers (COMPUTE), and two on calculating answers (COMPUTE). Thus, although all teachers were aware of the key role of visualization, most spent more time on other parts of the problem solving process. For example, two teachers extensively discussed the general context of each problem (e.g., what kinds of things one can buy in a supermarket) and six teachers placed considerable emphasis on calculating answers.
Table 3
Teachers’ time allocation (minutes) per step over all
teacher-modelled problems
Regarding when visual representations are used in the problem solving process and to what purpose, four patterns of usage were identified: (1) UNDERSTAND & VISUALIZE; (2) VISUALIZE; (3) VISUALIZE & COMPUTE; (4) COMPUTE. The upper part of Table 4 shows the amount of time spent (absolute and relative) on visualization following each of these patterns. The lower part of the table shows the corresponding types of visual representations (i.e., pictorial, arithmetical, visual-schematic) used. Individual differences between teachers are apparent.
The first pattern was observed when the problem text contained a lot of information or when students did not fully comprehend what was being asked. Visual representations (specifically, visual-schematic) were then occasionally used to help clarify the situation described in the text; the steps UNDERSTAND and VISUALIZE were then combined. Half of the teachers showed this pattern of behaviour.
The second pattern observed (i.e., VISUALIZE) occurred once the problem text was fully comprehended. Visual representations (pictorial, arithmetical and/or visual-schematic) were then sometimes used to separately depict the problem structure; these representations were not further used in calculating answers. All but one teacher demonstrated this pattern of usage.
With the third pattern, visual representations were used to both structure the problem and help calculate answers; the steps VISUALIZE and COMPUTE were then combined. All but one teacher used visual representations in this way. For four teachers, this was the main way in which they used visual representations and one teacher used them only in this way. Two distinct approaches were identified. With the first approach, a visual-schematic representation was used for structuring the problem and calculating answers. An example is shown in Figure 1. All teachers who showed the VISUALIZE & COMPUTE usage pattern worked in this way on at least one problem. The second approach - used by two teachers - used arithmetical representations (specifically, proportion tables) for this purpose.
Finally, with the fourth pattern (i.e., COMPUTE), visual representations (specifically arithmetical) were used only to calculate answers. This often followed the situation in which a pictorial or visual-schematic representation was used in the VISUALIZE step, or followed directly from the text comprehension step (UNDERSTAND) in cases where the VISUALIZE step was omitted. Six teachers used visual representations in this way.
Table 4
Patterns of visual representation usage over all
teacher-modelled problems
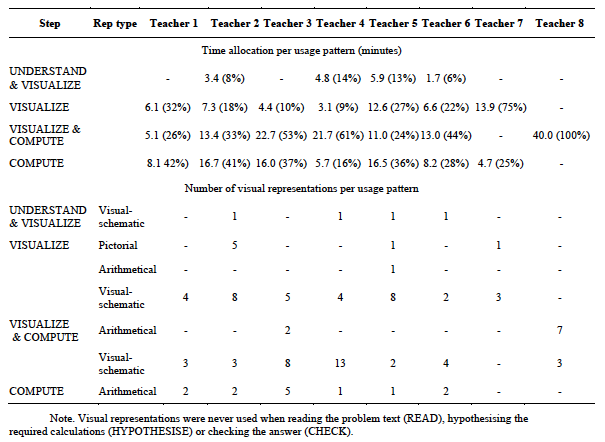
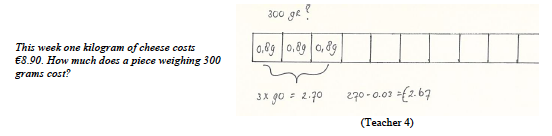
Figure 1. Example visual-schematic representation used to calculate answers.
There were considerable differences between teachers with respect to the type and form of visual representations used. Regarding types, (i.e., pictorial, arithmetical, visual-schematic) all but one teacher used mainly visual-schematic representations. Though teachers were aware of the importance of these visual representations, pictorial and arithmetical representations were also used, however (see Table 5).
Table 5
Teachers’ use of representation types over all teacher-modelled
problems
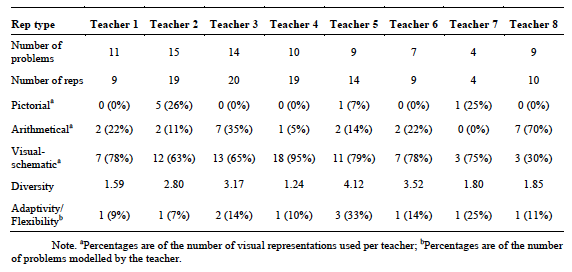
Figure 2 shows teachers’ relative use of different representational forms (i.e., bar model, pie chart, number line, proportion table, own construction, pictorial). Note that though pictorial representations are considered a type, they are included here to give a complete picture of the visual representations used. The most frequent form of visual-schematic representation was the bar model, which was used by all but one teacher. Number lines were used by four teachers, while pie charts were very infrequently used, by four teachers. The only form of arithmetical representation used was proportion tables. This was used by all but one teacher.
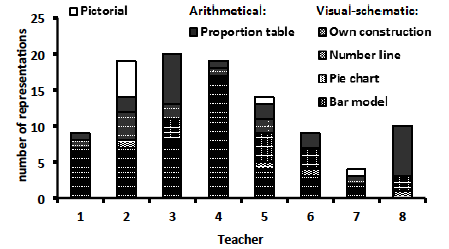
Figure 2. Teachers’ use of representational forms over all teacher-modelled problems.
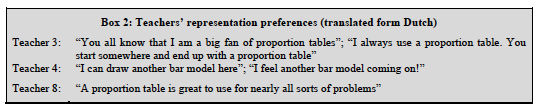
The extent to which teachers exhibited a varied use of representational forms (i.e., diversity) differed between teachers, varying from 1.24 to 4.12 on a scale of 1 (only one representational form used) to 5 (all representational forms used equally) (see Table 5). Excluding pictorial representations, one teacher used five representational forms including own constructions, two teachers used four forms, four teachers used three forms and one teacher used two forms. Some teachers verbally expressed and demonstrated a preference for a certain representational form. Two teachers showed a strong preference for bar models (although one of these systematically used them incorrectly, as will be discussed later) and two teachers had a strong preference for proportion tables. Quotations that reflect teachers’ representation preferences are reported in Box 2.
Teachers demonstrated a low to medium degree of adaptivity/flexibility in representation use. All offered multiple representational forms (arithmetical and visual-schematic) on the same problem at least once (see Table 5). Five teachers used different forms of visual-schematic representation in this way. Four combined a bar model with their own schematic drawing of the problem structure; two offered different visual-schematic mathematical models (number line, bar model and/or pie chart). Five teachers used both visual-schematic and arithmetical representations on the same problem at least once. Remarkably, three teachers modelled at least one problem without using any visual representation at all. Teachers rarely compared the use of different representational forms or reflected critically on what different kinds of representation contribute to word problem solving. This was particularly the case for teachers who had an expressed preference for using a specific form, who showed a tendency to use their preferred form irrespective of problem characteristics.
Teachers were expected to model the representation process transparently, correctly and completely, whereby they should emphasize reasoning processes and understanding the actions undertaken. Thus, teachers were expected to explicitly explain which problem elements should be modelled and how, which representational forms are suitable to do this and why, and which actions they take in constructing the visual representations step-by-step. All eight teachers showed these kinds of behaviours to a considerable degree, with average transparency ratings of 2.11-3.00 on a three-point scale (see Table 6). The extent to which teachers provided this reasoning themselves or stimulated students to provide it varied between teachers, however. Two teachers also encouraged students to suggest which visual representations to use.
Table 6
Quality of representation processes and visual representations
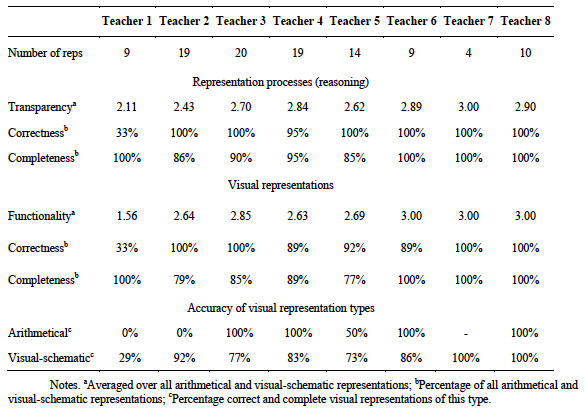
Correctness of reasoning in the representation process was high (95% and above) for seven of the eight teachers. Remarkably, one teacher (Teacher 1) reasoned correctly on only 33% of visual representations. The main source of error appeared to be an incorrect understanding of what a bar model is: she drew boxes that she called bar models within which she wrote the sum in symbolic notation. This teacher along with three others also used a bar model form as a proportion table, with the numbers written in the bars bearing no relation to the spatial-numerical relations. Another teacher (Teacher 7) expressed the belief that it is not possible to make a visualization for every type of problem, though his reasoning was correct for the representations that he did make. Completeness of reasoning was also high (95% and above) for five teachers, while the remaining three teachers demonstrated complete reasoning on 85-90% of the visual representations used.
There were differences between teachers concerning the quality of the visual representations used. All teachers produced at least one accurate (i.e., correct and complete) visual-schematic representation, though accuracy varied from 29% to 100% for this representation type (see last row of Table 6). Only two teachers were fully accurate on all visual-schematic representations, while the teacher who demonstrated low correctness of reasoning produced accurate visual-schematic representations only 29% of the time. Four teachers constructed visual-schematic representations that were incorrect (i.e., depicting erroneous problem elements or relations) and four teachers constructed visual-schematic representation that were incomplete (i.e., missing solution-relevant elements and/or relations). Examples of accurate and inaccurate visual-schematic representations are given in Figure 3. The arithmetical representations of four teachers were all accurate (i.e., correct and complete), but three teachers produced incorrect or incomplete arithmetical representations (one teacher never used these visual representations, see Table 5).
Yesterday, Fenna had €337.65 in her bank account. Her new statement shows that her grandmother deposited €45 for her school report and she earned €11.75 for babysitting. How much money does she have in her account now?
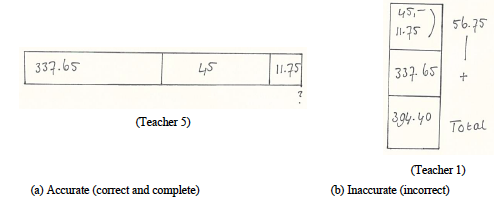
Figure 3. Examples of (a) accurate and (b) inaccurate visual-schematic representations.
The extent to which teachers invested in understanding what was being asked in the problem text - particularly when the text contained much information - directly impacted the functionality (i.e., suitability and usefulness) of the visual representations used. With one exception, teachers’ visual representations generally had good functionality, with average ratings of 2.63-3.00 on a three-point scale (see Table 6). However, the visual representations of the teacher who showed low correctness of reasoning had lower functionality (average rating 1.56), which could be expected. Functionality was also lower when teachers did not correctly identify the solution-relevant elements; in these cases, they tended to produce visual representations that contained excess, irrelevant information. Figure 4(a) shows an example of such a visual-schematic representation, with unnecessary calculation of intermediate arrival and departure times. Furthermore, teachers used bar models more frequently than other visual-schematic representations, even on problems involving percentages that were suitable for a pie chart, or addition and subtraction problems that were suitable for using a number line. Figure 4(b) shows an example of a bar model used (inaccurately) when a number line would have been more suitable.
Antoine and Bertrand travel with the train from Utrecht to Paris via Den Bosch, Roosendaal, and Brussels. They depart at 13.38 from Utrecht Central Station. After 28 minutes they arrive in Den Bosch. They have to wait 13 minutes before the train to Roosendaal leaves. The journey to Roosendaal takes 52 minutes. In Roosendaal they have 23 minutes to change to the train to Brussels. The journey to Brussels takes 1 hour and 10 minutes. After 55 minutes, the train departs from Brussels to Paris: a journey of 1 hour and 22 minutes. At what time do Antoine and Bertrand arrive in Paris?
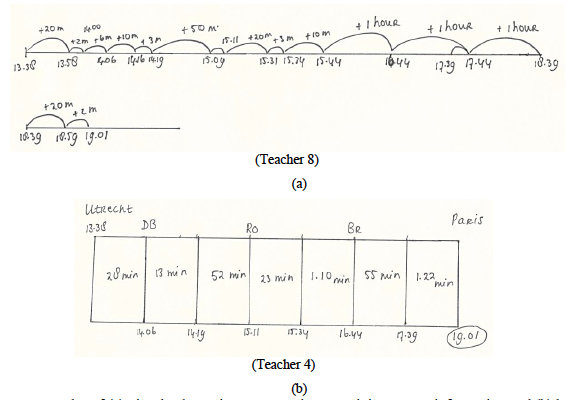
Figure 4. Examples of (a) visual-schematic representation containing excess information and (b) bar model used to solve addition problem.
The goal of this study was to examine teachers’ use of visual representations when implementing a teaching intervention for supporting non-routine word problem solving. The teaching intervention focused on the construction of accurate visual-schematic representations, embedded within a sequence of six problem solving steps. It differs from previous research into supporting word problem solving (e.g., Jitendra, 2002; Montague, 2003; Montague et al., 2000) in several respects relating to both the educational setting and the way in which it is implemented. First, the teaching intervention was not implemented with low-performing students with special educational needs, but in regular, mainstream classrooms. Second, the intervention was not designed for individual or small group instruction, but for use in whole-class teaching. Third, the intervention was not carried out by researchers but by mainstream teachers.
Furthermore, while the intervention was based on existing stepwise strategy instruction programs to support non-routine word problem solving, it incorporated an important innovation. Where existing programs define visual representation in heuristic terms, the present teaching intervention specifically defines the criteria that should be satisfied: a visual representation should clarify the problem structure by making the numerical, linguistic and spatial relations between solution-relevant elements visible. The study therefore makes an unique contribution to research in the important and problematic area of word problem solving in regular classrooms.
To address the study objective, three research questions were posed. We first examined teachers’ attention to visualization when implementing the teaching intervention and determined when they use visual representations in the word problem solving process and to what purpose. Answering this question provides insights into teachers’ use of visual representations. We also investigated what kinds of visual representation teachers use, the extent to which teachers show a diverse and adaptive/flexible use of representations, and the quality of the representation process and of the visual representations used. This information could inform research, teacher training and professionalization with respect to improving teachers’ expertise with visual representations.
Teachers were trained in the use of the teaching intervention and were aware of its focus on visualization (i.e., the construction of a visual representation of problem structure). It could therefore be expected that teachers would pay the most attention to the VISUALIZE step, in comparison to the other problem solving steps. This was not the case, however: most teachers spent most time on other parts of the problem solving process, namely understanding problem text and computing answers.
Extensive time spent on the UNDERSTAND step could be explained by the fact that teachers regularly did not apply the intended strategies for clarifying what was asked (e.g., paraphrasing the text and imagining the described situation) but instead spent a lot of time discussing irrelevant contextual information. This indicates that teachers are unfamiliar with and therefore need to master strategies for supporting text comprehension if they are to effectively support word problem solving of students.
Teachers’ focus on correctly performing the required arithmetical computations is not surprising, given that instructional methods commonly used in mainstream classrooms and teacher training award much more attention to calculating correct answers than to understanding the problem text. Consequently, teachers are generally used to spending most time on the solution phase of the word problem solving process, and this practice is likely to have been perpetuated in the current setting.
Teachers routinely combined the VISUALIZE step with the UNDERSTAND or COMPUTE step. This stands in sharp contrast to existing research-based programs for supporting word problem solving of low-performing students, which assume that word problem solving is a sequential (i.e., step-by-step) process (Krawec, 2010; Montague et al., 2000). The results of the present study show that, in authentic classroom settings, word problem solving need not always occur sequentially - steps can be combined such that problem comprehension and solution interact and emerge together. Theories of word problem solving therefore need to recognize the potentially iterative nature of the process, particularly for non-routine problems.
Most teachers made ample use of visual-schematic representations (i.e., visual representations that represent the problem structure, the solution-relevant elements and the relations between them), though some seemed unclear about what these representations comprise and what function they serve within the word problem solving context. This is in line with research findings from other countries (e.g., Dreher & Kuntze, 2015; Orrill et al., 2008; Turner, 2008). Moreover, some teachers also made frequent use of arithmetical representations - specifically, proportion tables. In contrast to visual-schematic representations, arithmetical representations support only calculation processes rather than problem comprehension. Thus, when the problem text is not well understood, using only this kind of representation bears the risk that it does not contain the solution-relevant elements of the problem to be solved. Even after training, teachers appeared not always to be aware of this difference in the use of these types of representations.
Teachers appeared to have strong preferences for using one particular form of visual representation, namely a bar model or proportion table. Given these preferences, it is not surprising that teachers showed limited diversity and adaptivity/flexibility in representation use. This could be explained by the fact that these representational forms are frequently offered in math textbooks in elementary schools and teacher education. Teachers consequently may feel more comfortable using them, as they encounter them more often and have more knowledge about them. This may also explain the finding that teachers rarely considered or compared the suitability of the representations used. Nonetheless, an imbalanced and/or inflexible use of representations can be problematic when teachers are unable to respond appropriately to students’ needs (Jitendra et al., 2007) (e.g., students may find a number line more helpful than a bar model for certain sorts of problems) or to problem characteristics (e.g., a pie chart is more suitable than a bar model for solving a problem involving percentages). Thus, the diverse and adaptive/flexible use of visual representations is clearly an issue to be addressed in teacher training and professionalization.
The finding that teachers demonstrated medium to high transparency in the way in which they provided explicit, step-by-step reasoning about what information should be represented and how to represent it is compatible with the nature of contemporary math education, which emphasizes reasoning processes and understanding (Barnes, 2005; Van den Heuvel-Panhuizen, 2003; Webb, Van der Kooij, & Geist, 2011). Several teachers extensively involved students in this process; the explicit interaction between teacher and students is also one of the underlying principles of contemporary math education (Van den Heuvel-Panhuizen, 2003; Webb et al., 2011).
It is worrying, though, that while the majority of teachers generally demonstrated high correctness of reasoning, one teacher appeared to hold a fundamental misconception of what a bar model is. Furthermore, the reasoning of half of the teachers was not always complete: visual representations were introduced but not further or fully explicated. Such incomplete reasoning is risky if students do not know how to use the representation in question: misconceptions can then arise that can be difficult to correct (Hill et al., 2008). A correct and complete representation process is therefore essential but is not always exhibited in teachers’ natural behaviours.
With respect to the quality of the representations themselves, only two teachers were consistently able to construct representations that both correctly and completely contained all solution-relevant elements, in spite of the training received. It is highly likely that other mainstream teachers (who have not been explicitly trained in this area) would also have difficulty in producing correct and complete visual representations. Furthermore, some teachers were unable to come up with a suitable visual representation for some problems and seemed to think that they were making a visual representation when in fact they were sometimes merely structuring the words in the text. Clearly, teachers’ expertise in this area needs to be improved. Also, some teachers produced representations containing excess, irrelevant information, largely as a consequence of insufficient understanding of what was being asked. Such representations make calculating the answer more difficult and error-sensitive than necessary, and make it unclear what information is solution-relevant and what is not. This suggests that teachers, as well as students, need to develop effective strategies for understanding what is being asked in non-routine word problems.
Based on these findings, it can be concluded that the use of visual representations to support word problem solving should be given much more attention in teacher education and teacher professionalization programs. While the quality of the representation processes and the representations produced by most of the teachers in this study was reasonable, some misconceptions and inappropriate use of certain representational forms were observed. It could be argued that anything less than teachers’ full mastery in this area is undesirable (cf. Ball et al., 2008).
Furthermore, the limited diversity and adaptivity/flexibility are matters of concern. While routine, algorithmic problems can be solved by applying pre-existing templates, non-routine problems require a problem-specific approach. In these cases, a limited and inflexible use of representations can result in an ineffective and inefficient problem solving process. Teachers therefore need to possess a broad repertoire of visual representations and understand their conditions of use, so that they are able to offer representations that both match problem characteristics and support students’ needs, as posited in the concept of MKT (Ball et al., 2008). It is important, therefore, to develop teachers’ knowledge of the characteristics and purpose of different types and forms of visual representation, as well as understanding when and how to use them to support word problem solving. This notion should be seen in conjunction with the work of diSessa (2002) on the existence of metarepresentational competence of students in mathematics and science. Metarepresentational competence (MRC) refers to the full complex of abilities dealing with representational issues. It concerns the ability to design new representations, including both creating representations and judging the adequacy for particular purposes. It also includes understanding how representations work, how to work out representations for different purposes, and what the purposes of representations are (diSessa, 2002; Verschaffel, Reybrouck, Jans & Van Dooren, 2010). In addition to the studies of diSessa (2002) and Verschaffel et al. (2010) which are focused on students’ level of MRC, the findings of this study show that it is also important to look at teachers’ development of a true representational literacy (see diSessa, 2002, p. 105). Metarepresentational competence should, among others, have a prominent place in teacher education and teacher professionalization programs (e.g., Dreher &Kuntze, 2015; Orill et al., 2008; Verschaffel et al., 2010). In addition, attention needs to be paid to mastering strategies for supporting text comprehension. Teachers need to learn how to identify the solution-relevant information in the word problem and, on the basis of that information, how to derive the specific questions that have to be answered. This should prevent teachers from spending too much time on irrelevant details which do not facilitate - and may even hinder - problem comprehension and solution.
The participants in this study were recruited through purposive sampling of teachers who were motivated to participate in and considered themselves competent to contribute to research in this area. This ensured that results were obtained under favourable conditions in which teacher behaviour is not negatively influenced by motivational factors that are known to undermine the way in which teachers implement educational innovations in regular classrooms (e.g., Evers et al., 2002; Ghaith & Yaghi, 1997; Hermans et al., 2008; Rogers, 2003). Consequently, the findings cannot be directly generalized to the many mainstream teachers who have a negative attitude towards mathematics and are not confident about teaching mathematics (e.g., Bursal & Paznokas, 2006; Isiksal, Curran, Koc, & Askun, 2009; Swars, Daane, & Giesen, 2006). Nonetheless, we expect that since even motivated and confident teachers experience difficulties in using visual representations (such as limited diversity, adaptivity/flexibility and representational quality), difficulties experienced by other mainstream teachers might be more prominent. Thus, it is important to address the competences and needs of these teachers in future research.
Teachers were encouraged to use their own explanations and elaborations, rather than a fully scripted lesson protocol. In this way, teachers could implement the teaching intervention in a way that is compatible with their own teaching approach and beliefs about teaching. This is important for the successful implementation and feeling of ownership of educational innovations (Ketelaar, Beijaard, Boshuizen, & Den Brok, 2012). Nonetheless, it makes instruction vulnerable to potential shortcomings in teachers’ skills. Thus, even when teachers believe they master the skills necessary to implement an instruction correctly, they should be provided with explicit training in its key ingredients and be given the opportunity to adopt and consolidate new skills before it can be implemented in the classroom (Bitan-Friedlander, Dreyfus, & Milgrom, 2004). To this end, training should be lengthy enough to provide teachers with enough time to internalize change, that is, accept the innovation, acquire the necessary skills and be prepared to implement it (Bitan-Friedlander et al., 2004). Possibly, the present training was not of sufficient duration so that the desired level of competence was not attained. Future research should investigate the duration and intensity of training required to achieve this level of competence.
Finally, some teachers believed themselves to be competent while in fact they were not, with one teacher even holding a fundamental misconception. As realistic beliefs about one’s personal competence can positively influence individuals’ willingness to invest in training and education (Beets, Flay, Vuchinich, Acock, Li, & Allred, 2008; Han & Weiss 2005), it would be of interest to investigate how teachers can be helped to develop realistic beliefs about their pedagogical and didactical proficiency in the use of visual representations.
Acevedo Nistal, A., van Dooren, W.,
Clarebout, G., Elen, J., & Verschaffel, L. (2009).
Conceptualising, investigating and stimulating representational
flexibility in mathematical problem solving and learning: A
critical review. ZDM The International Journal on Mathematics
Education, 41, 627‑636. doi: 10.1007/s11858-009-0189-1
Ball, D. L., Thames, M. H., & Phelps, G. (2008). Content
knowledge for teaching: What makes it special? Journal of
Teacher Education, 59, 389‑407. doi:
10.1177/0022487108324554
Barnes, H. (2005). The theory of Realistic Mathematics Education
as a theoretical framework
for teaching low
attainers in mathematics. Pythagoras, 61, 42‑57. doi:
10.4102/pythagoras.v0i61.120
Beets, M. W., Flay, B. R., Vuchinich, S., Acock, A. C., Li, K.-K.,
& Allred, C. (2008). School climate and teachers’ beliefs and
attitudes associated with implementation of the positive action
program: A diffusion of innovations model. Prevention
Science, 9, 264‑275. doi: 10.1007/s11121-008-0100-2
Berends, I. E., & Van Lieshout, E. (2009). The effect of
illustrations in arithmetic problem-solving: Effects of increasing
cognitive load. Learning and Instruction, 19, 345–353.
doi: http://dx.doi.org/10.1016/j.learninstruc.2008.06.012
Bitan-Friedlander, N., Dreyfus, A., & Milgrom, Z. (2004).
Types of “teachers in training”: the reactions of primary school
science teachers when confronted with the task of implementing an
innovation. Teaching and Teacher Education, 20,
607‑619. doi: 10.1016/j.tate.2004.06.007
Boonen, A. J. H., Van der Schoot, M., Van Wesel, F., De Vries, M.
H., & Jolles J. (2013). What underlies successful word problem
solving? A path analysis in sixth grade students. Contemporary
Educational Psychology, 38, 271-279. doi: http://dx.doi.org/10.1016/j.cedpsych.2013.05.001
Boonen, A. J. H., Van Wesel, F., Jolles, J., & Van der Schoot,
M. (2014). The role of visual representation type, spatial
ability, and reading comprehension in word problem solving: An
item-level analysis in
elementary school children. International Journal of
Educational Research, 68, 15-26.
doi: http://dx.doi.org/10.1016/j.ijer.2014.08.001
Boonen, A. J. H., & Jolles, J. (2015). Comprehension &
Visualization: Teaching students to solve word problems. Research
& Reviews: Journal of Educational Studies, x, 1-4.
Bursal, M., & Paznokas, L. (2006). Mathematics anxiety and
preservice elementary teachers’ confidence to teach mathematics
and science. School Science & Mathematics, 106,
173‑180. doi: 10.1111/j.1949-8594.2006.tb18073.x
Carpenter, T. P., Corbitt, M. K., Kepner, H. S., Lindquist, M. M.,
& Reys, R. E. (1981). National assessment. In E. Fennema
(Ed.), Mathematics education research; Implications for the
80's (pp. 22‑ 38). Reston, VA: National Council of Teachers
of Mathematics.
Csíkos, C., Szitányi, J., & Kelemen, R. (2012). The effects of
using drawings in developing young children’s mathematical word
problem solving: A design experiment with third-grade Hungarian
students. Educational studies in mathematics, 81,
47-65. doi:10.1007/s10649-011-9360-z
Cummins, D. D., Kintsch, W., Reusser, K., & Weimer, R. (1988).
The role of understanding in solving word problems. Cognitive
Psychology, 20, 405‑438. doi: http://dx.doi.org/10.1016/0010-0285(88)90011-4
Depaepe, F., De Corte, E., & Verschaffel, L. (2010). Teachers'
approaches towards word problem solving: Elaborating or
restricting the problem context. Teaching and Teacher
Education, 26, 152‑160.
doi: 10.1016/j.tate.2009.03.016
Department for Education. (2013). National curriculum in England;
Mathematics programmes of study: key stages 1 and 2. Retrieved
from www.gov.uk/government/publications/national-curriculum-in-england-mathematics-programmes-of-study.
diSessa, A. (2002). Students’ criteria for representational
adequacy. In K. Gravemeijer, R. Lehrer, B. Van Oers, & L.
Verschaffel (Eds). Symbolizing, modeling and tool use in
mathematics education (pp. 105-129). Dordrecht, Bosten,
Londen: Kluwer Academic Publishers.
Dreher, A., & Kuntze S. (2015). Teachers' professional
knowledge and noticing: The case of multiple representations in
the mathematics classroom. Educational Studies in
Mathematics, 88, 89‑114. doi: 10.1007/s10649-014-9577-8
Elia, I., Van den Heuvel-Panhuizen, M., & Kolovou, A. (2009).
Exploring strategy use and strategy flexibility in non-routine
problem solving by primary school high achievers in
mathematics. ZDM, 41, 605-618.
doi: 10.1007/s11858-009-0184-6
Evers, W. J. G., Brouwers, A., & Tomic, W. (2002). Burnout and
self-efficacy: A study on teachers’ beliefs when implementing an
innovative educational system in the Netherlands. British
Journal of Educational Psychology, 72, 227‑243.
doi: 0.1348/000709902158865
Ghaith, G., & Yaghi, H. (1997). Relationships among
experience, teacher efficacy, and attitudes toward the
implementation of instructional innovation. Teaching and
Teacher Education, 13, 451‑458.
doi: 10.1016/S0742-051X(96)00045-5
Han, S. S., & Weiss, B. (2005). Sustainability of teacher
implementation of school-based mental health programs. Journal
of Abnormal Child Psychology, 33, 665–679.
doi: 10.1007/s10802-005-7646-2.
Hegarty, M., & Kozhevnikov, M. (1999). Types of visual–spatial
representations and mathematical problem solving. Journal of
Educational Psychology, 91, 684–689. doi: http://dx.doi.org/10.1037/0022-0663.91.4.68
Heinze, A., Star, J. R., & Verschaffel, L. (2009). Flexible
and adaptive use of strategies and representations in mathematics
education. ZDM, 41, 535-540.
doi:10.1007/s11858-009-0214-4
Hermans, R., Tondeur, J., Van Braak, J., & Valcke, M. (2008).
The impact of primary school teachers’ educational beliefs on the
classroom use of computers. Computers & Education, 51,
1499‑1509. doi: 10.1016/j.compedu.2008.02.001
Hill, H. C., Blunk, M. L., Charalambous, C. Y., Lewis, J. M.,
Phelps, G. C., Sleep, L., & Ball, D. L. (2008). Mathematical
knowledge for teaching and the mathematical quality of
instruction: An exploratory study. Cognition and Instruction,
26, 430‑511. doi; 10.1080/07370000802177235
Isiksal, M., Curran, J. M., Koc, Y., & Askun, C. S. (2009).
Mathematics anxiety and mathematical self-concept: Considerations
in preparing elementary-school teachers. Social Behavior and
Personality, 37, 631‑644. doi:
10.2224/sbp.2009.37.5.631
Jiminez, L., & Verschaffel, L. (2014). Development of
children’s solutions of non-standard arithmetic word problem
solving. Revista de Psicodidáctica, 2014, 19, 93‑123.
doi: 10.1387/RevPsicodidact.7865
Jitendra, A.K. (2002). Teaching students math problem-solving
through graphic representations. Teaching Exceptional
Children, 34, 34‑38. doi: 10.1177/004005990203400405
Jitendra, A.K., DiPipi, C. M., & Perron-Jones, N. (2002). An
exploratory study of schema based word problem solving instruction
for middle school students with learning disabilities: An emphasis
on conceptual and procedural understanding. The Journal of
Special Education, 36, 23–38. doi: http://dx.doi.org/10.1177/00224669020360010301
Jitendra, A. K., Griffin, C. C., Haria, P., Leh, J., Adams, A.,
& Kaduvettoor, A. (2007). A comparison of single and multiple
strategy instruction on third-grade students' mathematical problem
solving. Journal of Educational Psychology, 99,
115‑127. doi: 10.1037/0022-0663.99.1.115
Jitendra, A. K., Petersen-Brown, S., Lein, A. E., Zaslofsky, A.
F., Kunkel, A. K., Jung, P.-G., & Egan, A. M. (2013). Teaching
mathematical word problem solving: The quality of evidence for
strategy instruction priming the problem structure. Journal
of Learning Disabilities, XX, 1‑22.
doi: 10.1177/0022219413487408
Jitendra, A. K., & Star, J. R. (2012). An exploratory study
contrasting high- and low achieving students' percent word problem
solving. Learning and Individual Differences, 22,
151‑158. doi: 10.1016/j.lindif.2011.11.003
Jitendra, A. K., Star, J. R., Starosta, K., Leh, J. M., Sood, S.,
Caskie, G., … Mack, T. R. (2009). Improving seventh grade
students’ learning of ratio and proportion: The role of
schema-based instruction. Contemporary Educational
Psychology, 34, 250‑264.
doi: 10.1016/j.cedpsych.2009.06.001
Ketelaar, E., Beijaard, D., Boshuizen, H., & Den Brok, P. J.
(2012). Teachers’ positioning towards an educational innovation in
the light of ownership, sense-making and agency. Teaching and
Teacher Education, 28, 273‑282.
doi: 10.1016/j.tate.2011.10.004
Krawec, J. L. (2010). Problem representation and mathematical
problem solving of students with varying abilities
(doctoral dissertation, University of Miami). Miami.
Krawec, J. L. (2012). Problem representation and mathematical
problem solving of students of varying math ability. Journal
of Learning Disabilities, XX, 1‑13.
doi: 10.1177/0022219412436976
Krippendorff, K. (2004). Reliability in content analysis: Some
common misconceptions and recommendations. Human
Communication Research, 30, 411‑433. doi: http://dx.doi.org/10.1111/j.1468-2958.2004.tb00738.x
Lewis, A. B., & Mayer, R. E. (1987). Students’
miscomprehension of relational statements in arithmetic word
problems. Journal of Educational Psychology, 79,
363‑371. doi: 10.1037/0022-0663.79.4.363
Montague, M. (2003). Solve It! A practical approach to
teaching mathematical problem solving skills. VA:
Exceptional Innovations, Inc.
Montague, M., Warger, C., & Morgan, T. H. (2000). Solve
It! strategy instruction to improve mathematical problem
solving. Learning Disabilities Research & Practice, 15,
110‑116. doi: 10.1207/SLDRP1502_7
Mullis, I.V.S. & Martin, M.O. (Eds.). (2013). Chestnut
Hill, MA: TIMSS & PIRLS International Study Center,
Boston College.
National Council of Teachers of Mathematics (NCTM). (2000). Principles
and standards for school mathematics. Reston, VA: National
Council of Teachers of Mathematics.
Noteboom, A. (2009). Fundamentele doelen rekenen-wiskunde
[Key objectives for arithmetic and math]. Enschede, The
Netherlands: SLO, National Expertise Center for Curriculum
Development.
OECD (2013). PISA 2012 Assessment and Analytical Framework:
Mathematics, Reading, Science,
Problem Solving and
Financial Literacy. PISA, OECD Publishing.
Orrill, C. H., Sexton, S., Lee, S.-J., & Gerde, C. (2008).
Mathematics teachers’ abilities to use and make sense of drawn
representations. In The International Conference of the
Learning Sciences 2008: Proceedings of ICLS 2008. Mahwah,
NJ: International Society of the Learning Sciences.
Prenger, J. (2005). Taal telt! Een onderzoek naar de rol van
taalvaardigheid en tekstbegrip in het realistische
rekenonderwijs. [Language counts! A study into the role of
linguistic skill and text comprehension in realistic mathematics
education]. Doctoral dissertation, University of
Groningen, The Netherlands.
Pantziara, M., Gagatsis, A. & Elia, I. (2009). Using diagrams
as tools for the solution of non-routine mathematical problems. Educational
Studies in Mathematics, 72, 39‑60.
doi: 10.1007/s10649-009-9181-5
Rogers, E. M. (2003). Diffusion of innovations (5th ed.).
New York: Free Press.
Schoppek, W., & Tulis, M. (2010). Enhancing arithmetic and
word-problem solving skills efficiently by individualized
computer-assisted practice. The Journal of Educational
Research, 103, 239‑252.
doi: 10.1080/00220670903382962
Sharma, U., Loreman, T., & Forlin, C. (2012). Measuring
teacher efficacy to implement inclusive practices. Journal of
Research in Special Educational Needs, 12, 12‑21.
doi: 10.1111/j.1471-3802.2011.01200.x
Shulman, L. S. (1987). Knowledge and teaching: Foundations of the
new reform. Harvard Educational Review, 57, 1‑22. doi:
http://dx.doi.org/10.17763/haer.57.1.j463w79r56455411
Simpson, E. H. (1949). Measurement of diversity. Nature,
163, 688. doi: http://dx.doi.org/10.1038/163688a0
Swanson, H. L., Lussier, C. M., & Orosco, M. J. (2013).
Cognitive strategies, working memory, and growth in word problem
solving in children with math difficulties. Journal of
Learning Disabilities, XX, 1‑20.
doi: 10.1177/0022219413498771
Swars, S. L., Daane, C. J., & Giessen, J. (2006). Mathematics
anxiety and mathematics teacher efficacy: What is the relationship
in elementary preservice teachers? School Science and
Mathematics, 106, 306‑315.
doi: 10.1111/j.1949-8594.2006.tb17921.x
Turner, F. (2008). Beginning elementary teachers’ use of
representations in mathematics teaching, Research in
Mathematics Education, 10, 209‑210. doi:
10.1080/14794800802233795
Van den Heuvel-Panhuizen, M. (2003). The didactical use of models
in realistic mathematics education: An example from a longitudinal
trajectory on percentage. Educational Studies in Mathematics,
54, 9‑35. doi: 10.1023/B:EDUC.0000005212.03219.dc
Van der Veen, I., Smeets, E., & Derriks, M. (2010). Children
with special educational needs in the Netherlands: Number,
characteristics and school career. Educational Research,
52, 15‑43. doi: 10.1080/00131881003588147
Van Dijk, I. M. A. W., Van Oers, H. J. M., & Terwel, J.
(2003). Providing or designing? Constructing models in primary
math education. Learning and Instruction, 13, 53‑72.
doi: http://dx.doi.org/10.1016/S0959-4752(01)00037-8
Van Dijk, I. M. A. W., Van Oers, B., Terwel, J., & Van den
Eeden, P. (2003a). Strategic learning in primary mathematics
education: Effects of an experimental program in modeling. Educational
Research and Evaluation, 9, 161‑187. doi:
http://dx.doi.org/10.1076/edre.9.2.161.14213
Van Garderen, D. (2006). Spatial visualization, visual imagery,
and mathematical problem solving of students with varying
abilities. Journal of Learning Disabilities, 39,
496–506. doi: http://dx.doi.org/10.1177/00222194060390060201
Van Garderen, D., & Montague, M. (2003). Visual–spatial
representation, mathematical problem solving, and students of
varying abilities. Learning Disabilities Research &
Practice, 18, 246–254. doi: http://dx.doi.org/10.1111/1540-5826.00079
Verschaffel, L., De Corte, E., Lasure, S., Van Vaerenbergh, G.,
Bogaerts, H., & Ratinckx, E. (1999). Learning to solve
mathematical application problems: A design experiment with fifth
graders. Mathematical thinking and learning, 1,
195-229. doi: http://dx.doi.org/10.1207/s15327833mtl0103_2
Verschaffel, L., Greer, B., & De Corte, E. (2000). Making
sense of word problems. Swets and Zeitlinger: Lisse.
Verschaffel, L., Reybrouck, M., Jans, C., & Van Dooren, W.
(2010). Children's criteria for representational adequacy in the
perception of simple sonic stimuli.Cognition and Instruction, 28,
475-502.
Webb, D. C., Van der Kooij, H., & Geist, M. R. (2011). Design
research in the Netherlands: Introducing logarithms using
Realistic Mathematics Education. Journal of Mathematics
Education at Teachers College, 2, 47‑52.
Willis, G. B., & Fuson, K. C. (1988). Teaching children to use
schematic drawings to solve addition and subtraction word
problems. Journal of Educational Psychology, 80,
192-201. doi: http://dx.doi.org/10.1037/0022-0663.80.2.192
a) This week one kilogram of cheese costs €8.90. How much does a piece weighing 300 grams cost?
b) Yesterday, Fenna had €337.65 in her bank account. Her new statement shows that her grandmother deposited €45 for her school report and she earned €11.75 for babysitting. How much money does she have in her account now?
c) Antoine and Bertrand travel with the train from Utrecht to Paris via Den Bosch, Roosendaal, and Brussels. They depart at 13.38 from Utrecht Central Station. After 28 minutes they arrive in Den Bosch. They have to wait 13 minutes before the train to Roosendaal leaves. The journey to Roosendaal takes 52 minutes. In Roosendaal they have 23 minutes to change to the train to Brussels. The journey to Brussels takes 1 hour and 10 minutes. After 55 minutes, the train departs from Brussels to Paris: a journey of 1 hour and 22 minutes. At what time do Antoine and Bertrand arrive in Paris?
d) A truck has a loading box of 4.5 metres long, 2.5 metres wide and 0.5 metres high. The truck drives back and forth to a construction site with sand and gravel. Because the truck does not want to lose too much sand and gravel, the truck is filled to the brim and not higher. There lies 144 m3 sand at the construction site. How often should the truck drive back and forth with the sand?
e) The students from the upper grades of elementary school De Zonnewijzer have a sports day. All children of grade 3, 4, 5 and 6 are participating. Grade 3 has 20 students, grade 4 has 25 students, grade 5a has 21 students, grade 5b has 23 students, grade 6a has 19 students and grade 6b has 26 pupils. At the sports day in each grade a teacher is present. How many litre packs of milk must be purchased if every child and every teacher drinks one glass of 0.2 litres of milk?