![]()
Frontline Learning Research Vol. 9 No. 4 (2021)
116 - 140
ISSN 2295-3159
1Behavioral Science Institute,
Radboud University, Netherlands
2Department of Education, Utrecht University,
Netherlands
3Department of Online Learning and Instruction, Open
University of the Netherlands
Article received 3 June 2021/ revised 16 September/ accepted 4 November/ available online 7 December
Reading comprehension is a central skill in secondary education. To be able to provide adaptive instruction, teachers need to be able to accurately estimate students’ reading comprehension. However, they tend to experience difficulties doing so. Eye tracking can uncover these reading processes by visualizing what a student looked at, in what order, and for how long, in a gaze display. The question is, however, whether teachers could interpret such displays. We, therefore, examined how teachers interpret gaze displays and perceived their potential use in education to foster tailored support for reading comprehension. Sixty teachers in secondary education were presented with three static gaze displays of students performing a reading comprehension task. Teachers were asked to report how they interpreted these gaze displays and what they considered to be the promises and pitfalls of gaze displays for education. Teachers interpreted in particular reading strategies in the gaze displays quite well, and also interpreted the displays as reflecting other concepts, such as motivation and concentration. Results showed that teachers’ interpretations of the gaze displays were generally consistent across teachers and that teachers discriminated well between displays of different strategies. Teachers were generally positive about potential applications in educational practice. This study provides first insights into how teachers experience the utility of gaze displays as an innovative tool to support reading instruction, which is timely as rapid technological developments already enable eye tracking through webcams on regular laptops. Thus, using gaze displays in an educational setting seems to be an increasingly feasible scenario.
Keywords: Gaze displays; Teachers; Reading strategies; Secondary education; Eye tracking
Reading comprehension is a crucial skill for academic success (Murnane et al., 2012). As such, reading comprehension plays an important role in nearly all subjects in secondary education. To optimally support students’ reading comprehension, teachers should ideally provide students with adaptive support that is tailored to their personal needs (Van de Pol et al., 2019). However, since reading is mainly a covert process, in practice it can be difficult for teachers to get insight into students’ needs and tailor their instructions accordingly. Eye tracking might provide an innovative tool to visualize those covert processes, as it allows for constructing gaze displays. Gaze displays are visualizations of students’ eye movements during reading. Such displays have the potential to provide teachers with insights in the reading strategy used by a student, and as such, in the efficiency of the reading process. While eye tracking is currently not yet widely available to teachers, it can be expected to become a viable option in the near future: for instance, rapid technological developments already enable eye tracking through webcams on regular laptops (Madsen et al., 2021). Eye-tracking is in fact already being used in the educational practice in a school in Germany (Böhm, 2021). As such, investigating whether gaze displays could be a useful tool to support reading instruction is timely. Whether it can be a useful tool for educational practice, however, depends first of all on how teachers interpret the displays and how they translate the information provided by the gaze display into action (Molenaar & Knoop-van Campen, 2019), and secondly, on what promises and pitfalls of gaze displays teachers perceive. Therefore, the present study aims to explore how teachers interpret students’ gaze displays of reading assignments and perceive their usefulness.
Reading comprehension can be defined as “the understanding of the meanings of words as they are used in sentence contexts, comprehension of sentences, and the acquisition of new information from passages of prose” (Guthrie & Mosenthal, 1987, pp. 291-292). In this process, a mental construction of the meaning of the text is built with new information acquired from the text (Guthrie & Mosenthal, 1987; Pikulski & Chard, 2005). Efficient reading comprehension combines accuracy and reading time: Students quickly and correctly comprehend a text.
In building such a mental construction, reading strategies are important (Afflerbach et al., 2008). Reading strategies can be defined as purposeful, goal-directed actions which readers perform to achieve an established reading objective (Afflerbach et al., 2008). The choice for a certain reading strategy depends largely on the reading objective (Guthrie & Mosenthal, 1987; Urquhart & Weir, 1998). Reading strategies can be divided into two main categories: selective reading strategies and intensive reading strategies (Liu, 2010).
The selective strategy is used when the reader is looking for certain information (e.g., the answer to a specific question) without having to understand the rest of the text (Guthrie & Mosenthal, 1987; Krishnan, 2011). The parts of the text that do not contain the desired information are skipped (Liu, 2010). The intensive reading strategy is often used for making a summary of the text or when remembering a text for learning purposes (Katalayi & Sivasubramaniam, 2013; Krishnan, 2011; Liu, 2010). When applying this strategy, the reader reads the entire text as all information is necessary (Liu, 2010; Urquhart & Weir, 1998).
Effective regulation of reading strategies is an important aspect of academic achievement (Andreassen et al., 2017; Salmerón et al., 2017). There are various evidence-based best practices for reading comprehension instruction (Gambrell et al., 2011). Ideally, teachers have a balanced reading comprehension program (Duke & Pearson, 2009) which includes both explicit strategy instruction (Duffy, 2002) as well as support in the form of modelling reading strategies in action (Schutz & Rainey, 2020) and is tailored to students’ needs.
In practice, it can be difficult for teachers to tailor their instruction to the needs of the students. Since reading is a covert process, it is difficult for teachers to determine how students read texts and whether they apply reading strategies correctly and efficiently. The automaticity of viewing behavior makes it hard to report (Kok et al., 2017; Võ et al., 2016), so students’ self-reports are relatively susceptible to either purposefully or accidentally false answers (Benfatto et al., 2016; Shute & Zapata-Rivera, 2012). Teachers can have students read text aloud, but this is a time-consuming intervention and not suitable for classroom lessons. Therefore, the information that teachers can draw upon to tailor their instruction is often limited.
A way to uncover reading strategies is by capturing readers’ eye movements during reading using eye tracking and then visualize their eye movements in gaze displays (De Koning & Jarodzka, 2017; Knoop-van Campen et al., 2021; Van Gog & Jarodzka, 2013). A gaze display of a student’s reading behavior is a condensed visualization of large data sets of his/her eye-movement recordings, which are x- & y-coordinates of the focus of the eyes on a computer screen. Like learning analytics, they provide condensed summaries of large amounts of information (Almosallam & Ouertani, 2013).
In recent years, gaze displays have found several applications in education and educational research. For instance, visualizations of teachers’ gaze have been used to show learners where the teacher is looking (eye movement modeling examples), and this has been shown to often improve their learning from video examples (Chisari et al., 2020; Jarodzka et al., 2013; Mason et al., 2015; Scheiter et al., 2018; Van Gog et al., 2009). Furthermore, displays of students’ own gaze have been used to improve their self-assessment and self-regulated learning (Donovan et al., 2008; Eder et al., 2020; Henneman et al., 2014; Kok et al., 2017; Kostons et al., 2009).
Thus far, however, research on the use of gaze displays as a tool for teachers is limited. Existing research shows that people can interpret gaze displays of others to a certain extent, but interpretation performance differs between different tasks and stimuli. Specifically, studies indicate that people can identify search goals (Zelinsky et al., 2013), preferences (Foulsham & Lock, 2015), and deduce a given task (Bahle et al., 2017; Van Wermeskerken et al., 2018) from displays of someone else’s gaze. Emhardt et al. (2020) presented participants with gaze displays of students who answered multiple-choice questions about graphs. They found that participants could infer from those displays which answer a student selected, and if students were confident in their answers. In a study with teachers, Špakov et al. (2017) developed several different visualizations of gaze behavior of students learning to read and found that overall, teachers appreciated them, and considered them informative. However, they did not investigate how teachers interpreted those gaze displays, i.e., which information they extracted from the display, whereas teachers’ interpretations of this type of information are critical as they influence how they integrate the information in their professional routines (cf. Knoop-van Campen & Molenaar, 2020). To dive deeper into this question, we approach the interpretation of gaze displays with the Learning Analytics Process Model (Verbert et al., 2014). This provides a suitable framework for systematically analyzing teachers’ interpretations (Verbert et al., 2014).
The Learning Analytics Process Model distinguishes various stages (Van Leeuwen et al., 2021; Verbert et al., 2014). The awareness stage entails teachers becoming aware of the information. The interpretation stage involves teachers asking themselves questions and reflecting on the information they see, and trying to provide answers to these questions by interpreting and creating new insights into the data. Lastly, the enactment stage entails teachers using their interpretations and insights to induce new meaning or even change behavior (Verbert et al., 2014). How teachers interpret and use (learning analytics) information is strongly impacted by their experiences and routines (Molenaar & Knoop-van Campen, 2019). Gaze displays are currently not used in secondary education, so teachers do not have any experience in the use of gaze displays. Their interpretations might be arbitrary and undirected, possibly resulting in varied and contradicting interpretations of gaze displays. These interpretations are important, as they determine the contents of teachers’ actions realizing tailored reading instruction (cf. Jivet et al., 2017; Molenaar & Knoop-van Campen, 2019).
In sum, gaze displays seem to be a promising tool to provide information on covert processes like reading comprehension. Findings on how people in general interpret gaze displays, suggest that teachers might be able to extract information on students’ reading strategies from their gaze displays and compare that to their idea of an effective (desired) strategy. However, making inferences about students’ reading comprehension is arguably a much more complex task than e.g. inferring their preference for an object or multiple-choice answer from a gaze display (in which people tend to look more towards the preferred object or answer option), as it requires interpreting patterns of eye movements. In addition, teachers are known to differ largely in their way they interpret process data (Molenaar & Knoop-van Campen, 2019) which, in the case of reading comprehension tasks, may depend even more based on their own vision of (the importance of) efficient reading and reading strategies. Thus, it is unclear which information teachers would be able to extract from gaze displays of students’ reading behavior, and whether this is consistent between teachers.
The present study investigated how teachers interpret gaze displays and whether and how they would want to use gaze displays in teaching reading comprehension. Gaze displays are an innovative tool that could potentially support reading instruction, and the questions addressed in this study are timely as eye-tracking technology is rapidly developing and might become available for use in schools in the near future (as mentioned earlier rudimentary eye tracking is presently already enabled through webcams on regular laptops). Moreover, these questions are not only relevant for reading comprehension research and practice, but will also add to eye-tracking research on the use of gaze displays, by investigating whether people can also interpret gaze displays of more complex tasks.
Specifically, we examined whether teachers could discriminate between gaze displays that show different reading strategies and whether there was consistency among teachers in interpreting the same gaze displays. If teachers discriminate between gaze displays that reflect different reading strategies (i.e., distinguish between displays in their interpretation of them), this reflects that the visual information in the displays is interpreted in terms of (reading) processes that differ between students. If teachers are consistent in their interpretation of the same display (i.e., teachers agree in their interpretation of a display), this indicates that extracted information is interpreted similarly between teachers. Finally, we examined the promises and pitfalls teachers reported in working with gaze displays.
Participants were teachers who teach the subject Dutch at secondary schools (in the senior general and/or university preparatory tracks) across the Netherlands and as such, are knowledgeable ofreading comprehension strategies. All schools in the Netherlands in which senior general and/or university preparatory is taught were invited by e-mail to participate. Informed consent was provided by 125 participants. Only participants who answered all questions for at least one display were included, which totals 60 participants (46 female). The exact number of participants differs between analyses and is reported in the results section. For the full sample, teachers’ mean age was 45.4 (SD = 12.8) and they reported an average of 13.1 (SD = 9.2) years of working experience (range 0-38 years).
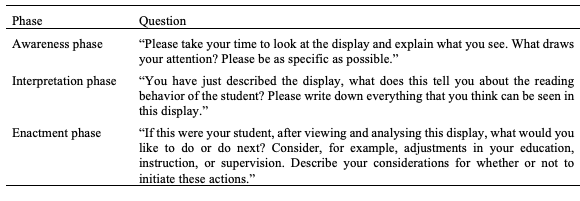
An explorative approach with open questions was used to elicit thoughts from teachers about gaze displays. In a questionnaire, secondary school teachers were presented with three different gaze displays of students who completed a reading comprehension assignment (see Figure 1). Teachers typed a response to three open questions per display and two open questions about displays in general. The Learning Analytics Process Model (Verbert et al., 2014) was used to query teachers’ awareness of the gaze displays (what did teachers observe), their interpretation (how did teachers interpret this information), and their enactment (how did teachers intend to act upon this information).
Concerning the question of how teachers interpret gaze displays, we coded their answers and examined whether teachers discriminate between gaze displays of different students and whether there is consistency among teachers regarding interpreting the same gaze displays. Finally, we examined the promises and pitfalls teachers reported in working with gaze displays by asking them about their views on implementing gaze displays in general in their reading comprehension education.
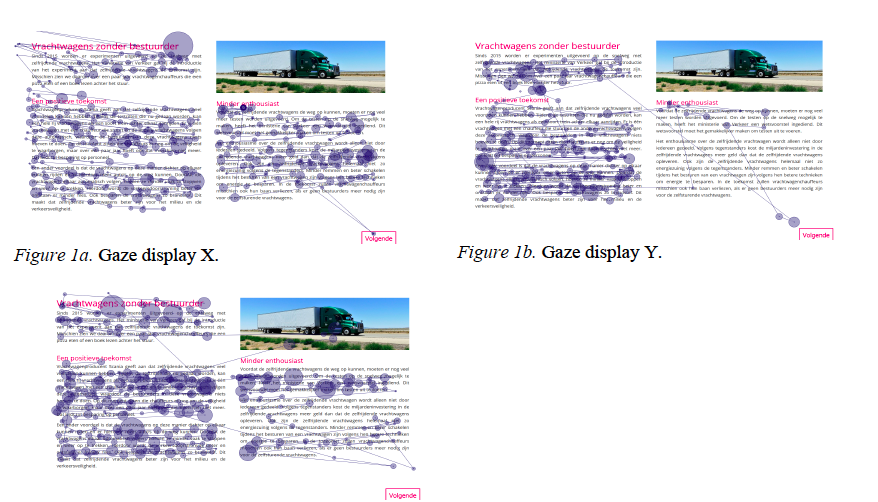
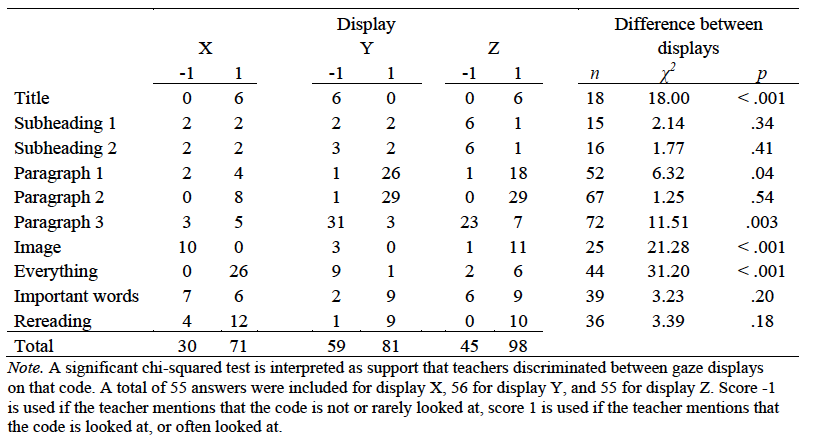
Figure 1c. Gaze display Z.
2.2.1 Gaze displays
Three static displays were used (see Figure 1). The displays were images of the eye-movement locations during the full trial. The gaze displays were taken from an earlier study (Knoop-van Campen et al., 2021). In that study, students received reading comprehension assignments which they made voluntary without time limit. Students received a reading comprehension task (“Which advantages of self-driving trucks are mentioned in the text?”), and subsequently were presented with the text in which they had to find the answer. The text consisted of three paragraphs (three Areas of Interest: AOIs) and was preceded by an open-ended question of which the answer is situated in the second paragraph (bottom left). After reading the text, they typed in their answer (without the opportunity to visit the text again).
An SMI RED-500 eye-tracker (SMI vision, Berlin, Germany) captured students’ eye movements during reading at 250 Hz. Gaze displays were developed in BeGaze 3.7 (SMI vision, Berlin, Germany) using the scanpath utility. Fixations were shown as circles with the size of the circle corresponding to the fixation duration (500 ms = 1 degree). Saccades were shown as lines between fixations. Fixations and saccades were defined using SMI’s standard velocity-based event-detection algorithm with peak velocity threshold of 40 degrees/second and minimum fixation duration of 50 ms.
The three gaze displays varied on the type of reading strategy used. The reading strategy (intensive or selective) was quantified with a so-called disparity score, which captures the duration of fixations across different parts of the text (see (Knoop-van Campen et al., 2021, for more information). This disparity score was calculated based on the standard deviation of the weighted fixation duration times in the three paragraphs. When the standard deviation is low, an equal amount of attention was given to all three paragraphs, while a high standard deviation indicates that the student focused mostly on one part of the text. This disparity score could vary between 0 (attention evenly divided over the three AOI’s: SD of 33%, 33%, and 33% is 0) and 57 (attention 100% focused on one AOI: SD of 100%, 0%, and 0% is 57). Based on an experts’ cut-off point and hand-coded validation, disparity scores below 14 were considered intensive reading strategies, and above 14 were considered selective reading strategies.
The three selected displays showed a clear intensive strategy (display X: disparity score = 1.42), a clear selective strategy (Display Y: disparity score = 25.25) and a borderline intensive strategy (display Z: disparity score = 11.73). Data quality was expressed in the tracking ratio (percentage of time samples where a valid x- & y-coordinate was recorded: display X: 97%, display Y: 98%, display Z: 100%) and deviation scores as retrieved using a four-point validation procedure after nine-point calibration (M = .62, SD = .53.
2.2.2 Measures
To elicit thoughts from teachers about their awareness, interpretation, and enactment of the gaze displays, three open-ended questions reflected these phases of the Learning Analytics Process Model (Verbert et al., 2014), see Table 1. To optimally grasp teachers’ motives, opinions on and attitudes towards gaze displays, the open-ended questions were phrased according to the interpretive paradigm (Tijmstra & Boeije, 2011) in such a way that allowed teachers to elaborate on their thoughts (e.g., “Please feel free to describe everything that comes to mind.”).
Table 1
Questions for Awareness, Interpretation, and Enactment
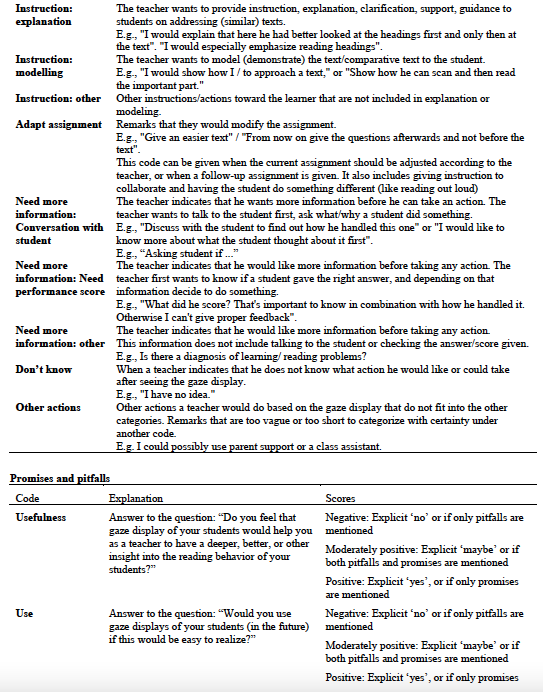
To collect teachers’ perceived promises and pitfalls of gaze displays, also open-ended questions asked whether they thought gaze displays could be useful in their educational practices. First, they were asked “Do you feel that gaze displays of your students would help you as a teacher to have a deeper, better, or other insight into the reading behavior of your students? Why do you think so?”. Then, they were asked “Would you use gaze displays of your students (in the future) if this would be easy to realize? For which goal would you use those displays? Which concrete actions would you want to realize?”. Again, teachers were invited to write down their answers.
2.2.4 Procedure
The online survey was developed in Qualtrics (Qualtrics, Provo, UT). The online survey mode enabled teachers to complete the survey at any time and place that was suitable for them within three weeks after receiving the invitation. Teachers spent on average approximately 23 minutes to complete the survey.
In this questionnaire, informed consent was given, following which participants answered demographic questions. Next, the different components of gaze displays were shortly explained (i.e., circles show where a person looks, larger fixations represent longer reading times, lines shown the route over the stimulus). Then the reading comprehension question and the accompanying text were displayed so teachers could become familiar with the material and knew students’ reading objective. Next, teachers were presented with consecutively the three gaze displays with corresponding questions (displays were anonymized, so teachers did not receive any student characteristic). The order in which the three gaze displays were presented, was randomized. Last, teachers were asked to comment on the usability of gaze displays in education in general.
2.2.5 Data analyses
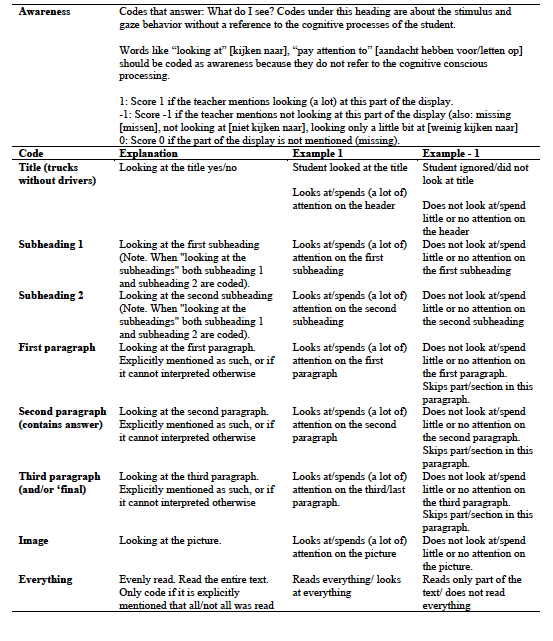
The Learning Analytics Process Model (Verbert et al., 2014) was used as the basis for coding the written responses of awareness, interpretation, and enactment of gaze displays. Additionally, open coding of all answers was conducted, to which (if necessary), theoretically relevant codes were added (such as those for strategies). To enable expressing consistency and discrimination, we created contrasting code scores for awareness and interpretation. For example, a score of 1 was given on the code ‘Title’ if the teacher mentioned that the student looked at the title, and a score of -1 was given if the teacher mentioned that the student did not look at the title. If the teacher did not mention the title at all, no score was given for that code. See Appendix A for the codebook including coding instructions and examples.
Coding took place in three rounds and by four coders. First, all four coders each coded the same ten cases and compared and discussed their answers, based on which the codebook was adapted. In round two, each coder coded 25% of the data plus 20% (in total 31 cases) as a second coder. The average Krippendorffs Alpha1 was 0.56 and the average percentage overlap was 92%. All variables (12 variables in total) with a Krippendorffs Alpha <.60 or percentage overlap <.80 were discussed. In round 3, these variables were recoded and a new 20% of overlapping cases were coded. One variable with a Krippendorffs Alpha of 0 was removed because only a few participants mentioned it. The final average Krippendorffs Alpha was 0.7 and the average percentage overlap was 94.1%2 .
For analyses, scores of 0 were defined as system-missing values, and subsequently, chi-squared tests were used to quantify teachers’ discrimination of displays. We considered a significant chi-square test as support that teachers discriminate between gaze displays on that code because it means that the pattern of -1 scores and 1 scores differs between gaze displays and that enough teachers mentioned this code to have the statistical power to detect differences. The average consistency within a code was the percentage of teachers who mentioned the most-mentioned score (either -1 or 1), averaged over the three displays. Consistency ranged between 50% (equal numbers of answers were scored as -1 or 1) to 100% (all answers were scored the same, as either -1 or 1).
The coding process for the perceived promises and pitfalls of gaze displays was similar to that of awareness, interpretation, and enactment. Each of the four coders coded 25% of the data and an additional 31 cases as a second coder (63% of data double coded). The average Krippendorffs Alpha was 0.71 and the percentage overlap was 93%. The three variables with a Krippendorffs Alpha < .60 or a percentage overlap of < .80 were discussed. Two of those were removed because the code was only used four times. The third variable was coded again and all cases were double-coded. However, Krippendorffs Alpha was negative after recoding, and since this code was also quite uncommon, it was dropped too. The final Krippendorffs Alpha thus stayed 0.71 with 93% overlap. Answers to the two questions were originally coded separately for each question, but most codes were combined since teachers reported pitfalls and promises as a response to both questions. See Appendix A for the final codebook.
3.1.1 Discrimination
Table 2 provides an overview of the frequency of scores per code per display.
Table 2
Frequency of Scores per Code about Awareness
The main differences between the three displays were in the way the respective students looked at the title, paragraph 3, and the image (see Figure 1). These differences were reflected in the remarks of the teachers (see Table 2): They discriminated between the three gaze displays for the title, paragraph 3, the image, and whether or not the student looked at everything, but not for subheading 1, subheading 2, paragraph 2, important words, and rereading. Surprisingly, teachers also discriminated between the three displays for paragraph 1, whereas the displays showed no obvious difference. This seems to be caused by more teachers mentioning paragraph 1 in displays Y and Z versus only a few teachers mentioning paragraph 1 in display X.
3.1.2 Consistency
Figure 2 shows the consistency (averaged over three displays) in each of the ‘awareness’ codes. A high consistency indicates that most teachers expressed observing the same viewing behavior. The three most consistent codes were image, paragraph 2, and title. For each of those, almost 100 % of teachers’ remarks were in the same direction. Variables in which teachers are least consistent were subheadings 1 and 2, and important words.
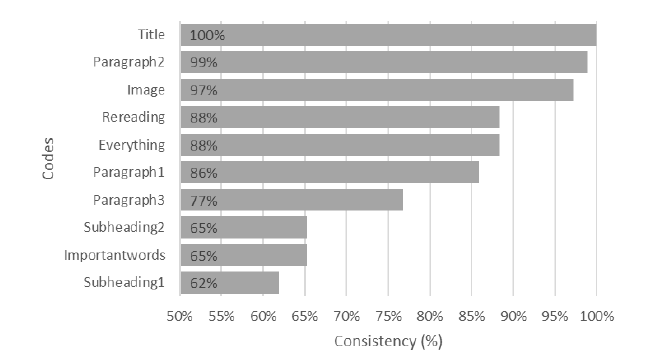
Figure 2. The Average Consistency within Awareness Codes. Note. Average consistency within a code is expressed as the average percentage of teachers who mention the most-mentioned score (either -1 or 1). A higher percentage means more consistency in answers, minimum consistency is 50% (equal number of remarks scores as -1 and as 1).
3.2.1 Discrimination
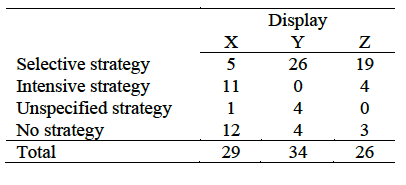
The main difference between gaze displays was in the reading strategy (see method section). Table 3 shows the frequencies with which each of the reading strategies were mentioned for each display. A Chi-squared test showed a significant discrimination between displays, χ2(6) = 37.12, p < .001, which is in line with the eye-tracking data: Display X shows an intensive strategy, display Y shows a selective strategy, and display Z showed a borderline intensive strategy.
Table 3
Frequencies for the Reading Strategies
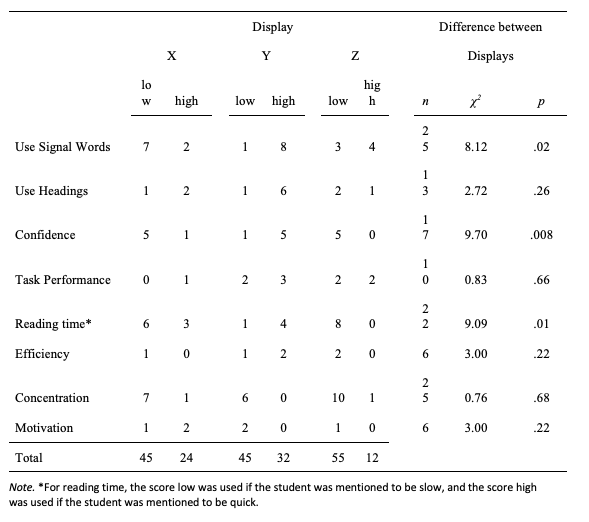
Apart from those overall reading strategies, teachers made remarks about more specific reading strategies, like the use of headings and signal words as strategies (see Table 4). Teachers discriminated between displays for the use of signal words but not for the use of headings.
Next to reading strategies, teachers also wrote down other interpretations of the gaze displays (see Table 4). Teachers discriminated between displays for confidence and reading time but not for task performance, efficiency, concentration, and motivation.
Table 4
Frequency of Scores for each Code about Interpretation
3.2.2 Consistency
Figure 3 shows the average consistency within the interpretation codes. Consistency was highest for concentration, motivation, and confidence. Consistency was lowest (but still relatively high) for task performance, use of headings, and the use of signal words.
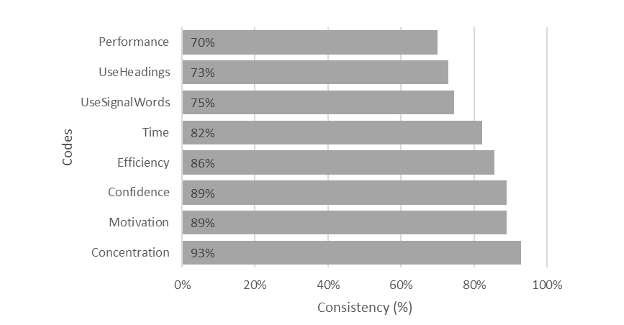
Figure 3. The Average Consistency within Interpretation Codes.
Note. Consistency (averaged over the three displays) within a code is expressed as the average percentage of teachers who mention the most-mentioned score (-1 or 1). Higher means more consistency in answers.
Table 3 shows consistency in the remarks regarding reading strategies. Display X shows relatively low consistency in codes (41%), in contrast to displays Y and Z (consistency respectively 76% and 73%), where most teachers remarked that a selective strategy was used. The relative low consistency on display X could be explained by the finding that the score ‘no strategy’ was given to sentences like ‘reads the full text without a clear strategy’ (P017X). In display X, the scores ‘intensive strategy’ and ‘no strategy’ together make up 79% of the remarks. 3.3 Enactment phase
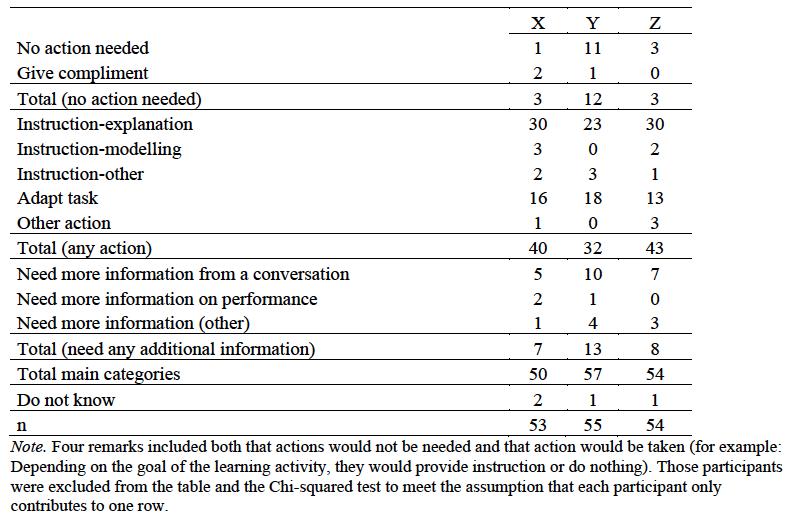
In the enactment phase, the main contrast was found between teachers who deem no actions necessary and those that would act on the gaze display. Additionally, several teachers mentioned that they need more information than just the gaze display. Table 5 provides an overview of the scores per display.
Table 5
Frequency of Enactment Codes
3.3.1 Discrimination
A chi-squared test was executed to investigate whether teachers would discriminate between displays regarding either initiating or not initiating action (any action vs. no action needed). The chi-squared test showed significant discrimination between the three displays, χ2(2) = 10.610, p = .005. Teachers were most likely to act on displays X and Z, and less so on display Y.
3.3.2 Consistency
The consistency was lowest for display Y, 72% of teachers would act on the displays, whereas for both displays X and Z almost all teachers (93%) would act on the displays.
Finally, we asked teachers which general promises and pitfalls they saw in working with gaze displays to support reading instruction. Most teachers responded positively (n = 31, 61%) or moderately positive (n = 15, 29%) to the question of whether the gaze displays would help them gather a deeper, better, or other insight into the reading behavior of their students. Only five teachers (10%) said displays would not support them. Furthermore, most teachers expressed a willingness to use gaze displays if this would be easy to realize. A total of 29 teachers (57%) would use them, 17 (33%) would maybe use them, 3 (6%) would not use them, and 2 teachers (4%) did not answer this question.
Promises of gaze displays mentioned by teachers were to give them insight into students reading behavior (n = 44, 86%). Additionally, part of the teachers said they would use displays to provide students with an insight into their own reading behavior, for example as feedback (n = 18, 35%). Next to that, several other applications were mentioned, such as supporting reading motivation and stimulating parent engagement. An important pitfall voiced by teachers was that they lack knowledge about eye tracking and feel that they need more training in gaze display interpretation (n = 11, 22%). Teachers also voiced practical concerns such as lack of time and resources (n = 9, 18%).
We investigated how teachers interpret and would implement gaze displays in teaching reading comprehension. Using the Learning Analytics Process Model (Verbert et al., 2014) we examined whether teachers discriminated between gaze displays and whether there was consistency among teachers.
In the awareness phase, the teachers’ pattern of remarks largely mirrors the actual pattern of eye-tracking data. This is reflected in the discrimination between gaze displays that differ and the limited discrimination in codes if gaze displays are minimally different. This suggests that teachers are indeed able to interpret the gaze displays in terms of the coded concepts. Inconsistency among teachers seems to stem from expectations of teachers and/or from data-quality issues. For example, whereas most teachers said that paragraph 3 is hardly read, some teachers said that paragraph 3 was read more than expected. E.g., “[the student] looks at section 4 of 5 more intensively, whereas those are not necessary to answer the question” (P004Z). Thus, whereas remarks coded as awareness might reflect just what can be seen, they are already influenced by the expectations that teachers have about how the student should look at the text. This is in line with the findings of Knoop-van Campen and Molenaar (2020) that teachers’ use of learning analytics information is embedded in their professional routines and expectations.
In the interpretation phase, many teachers interpreted gaze displays in terms of reading strategies. They discriminated correctly between displays and they were quite consistent in that. This supports the work of Knoop-van Campen and colleagues (2021) by showing that teachers can extract reading strategies from gaze displays. More detailed information about reading strategies such as the use of headings and signal words is gathered from the gaze displays, although not very consistently. Interestingly, teachers also made inferences about other aspects of students’ performance from the displays. For instance, concentration was quite consistently mentioned, although teachers did not discriminate between displays and generally interpreted the displays as showing low concentration. As we did not have information about students’ concentration, it is not possible to judge the accuracy of these aspects of teachers’ interpretations. It is important to investigate in future research to what extent gaze displays reliably reflect other aspects of study behavior or task performance, such as concentration, confidence, or invested effort and to what extent teachers can reliably pick up on this. On the one hand, it is not unlikely that these aspects of study behaviour can be inferred to a certain extent from specific eye movement patterns (cf. Emhardt et al., 2020; Rosengrant et al., 2021). On the other hand, we also know from research on teachers’ judgments of students’ performance, that teachers have a strong inclination to use more generic student characteristics in making those judgments (e.g., the motivation or effort they generally display in class), and that they will even ‘fabricate’ student characteristics when they lack information on a student’s identity. That is, when asked to judge students’ text comprehension or math performance based on performance data (i.e., a causal diagram the student filled out about the text), teachers tend to use the information they have about student characteristics, such as motivation, gender, intelligence, or concentration in class, to inform their judgments. However, teachers still do so even when they are presented with anonymized performance data, making statements about students having sloppy habits, having low concentration, being clever or uncertain, even though they did not know who the student was (Oudman et al., 2018; Van de Pol et al., 2021). Previous research in the classroom has shown that learning analytics can decrease teachers’ bias towards students (Knoop-van Campen et al., 2021). If teachers could reliably infer other aspects of study behavior or task performance (such as students concentration or effort on that specific task) from gaze displays, this could support teachers in providing better feedback and guidance on students learning processes.
In the enactment phase, most teachers would act on the displayed viewing behavior in some way, although teachers did discriminate between the three displays. Consistency was thus relatively high. Most actions that teachers mentioned concerned reading strategies. For example, explaining or modelling reading strategies to the student or adapting the task such that other reading strategies would be useful. These results support the notion of Xhakaj et al. (2017) that teachers can act on information on a display by altering their instruction, and that this positively affects their teaching (Knoop-van Campen et al., 2021). Apart from that, several teachers mention that the use of gaze displays alone does not provide enough information to act on.
Whereas teachers showed a certain amount of discrimination between displays and consistency within displays in all three stages, discrimination and consistency are still far from perfect in our sample. However, note that we did not train teachers to interpret gaze displays. Most teachers had never seen gaze displays before. This interpretation should thus be considered the lower boundary, and with more information, training, and practice, performance is likely to improve (Rienties et al., 2018).
Overall, the teachers were positive about the application of gaze displays in practice. They see many possible applications, but also acknowledge practical problems, even though these might decrease as time passes by and with technological improvements. Teachers saw applications of gaze displays both for their monitoring of student’s reading behavior (our intended application), but also considered gaze displays as potential feedback to students, which is an interesting idea that warrants further research (see e.g., Henneman et al., 2014, for an example of gaze as feedback in emergency medicine).
The present study had some limitations and also leads to suggestions for future research. First, interpretation performance is dependent on the display itself (Van Leeuwen et al., 2019). In this study, we selected displays of data that were not perfect. This is likely to impacte performance, but is also likely to happen in classroom situations, thus providing a realistic reflection of classroom practice. Also, the design of the display may have impacted how teachers interpreted it. For example, Van Wermeskerken and colleagues (2018) found differences between static and dynamic displays regarding participants’ interpretation performance. Furthermore, gaze behavior is not always straightforward. For example, displays X and Y showed clear examples of the two reading strategies, and indeed, teachers were relatively consistent in describing these strategies. Display Z showed more of a borderline strategy, which was reflected in a lower consistency in teachers’ remarks. As such, it would be relevant to investigate how characteristics of gaze displays impact teachers’ interpretation performance.
Secondly, due to the current set-up with open questions, it was not possible to assess the accuracy of most statements that teachers made regarding the eye-tracking data. Since the study aimed to unveil teachers’ thoughts about gaze displays (i.e., what information they would extract from a gaze display), we do not have the information from students regarding, for example, their motivation or concentration. In addition, as we asked teachers to elaborate on the presented displays, it was not feasible to use more than a few displays in the present study. Future research could seek a more confirmative approach, in which more displays are used that vary systematically over a larger set of measurements (e.g., strategies, reading performance, motivation, confidence) and in which teachers are asked to rate these measures (see for example the work of Emhardt et al., 2020). Future research could examine whether patterns of viewing behavior teachers distinguish relate to actual student behavior. For instance, teachers interpreted the use of headings and signal words from the gaze displays. Think-aloud studies could be used to investigate whether students used those strategies (Ericsson & Simon, 1993).
Third, our use of contrasting codes allowed us to make tentative statements about teachers’ judgment accuracy: High consistency combined with high discrimination is necessary if teachers were to validly use gaze displays to act upon. While this approach sensitized us to those contrasts, at the same time it may have diminished our attention to comments that were hard to capture in contrasts.
Finally, teachers were generally very positive about the gaze displays. However, participants who did not like the displays had probably selected themselves out earlier in the questionnaire. Indeed, only 41% of the participants who provided informed consent finished the survey. Further research is required to understand the willingness to use gaze displays in a representative sample of the population.
This study provides initial steps towards using gaze displays in the classroom to improve students’ reading comprehension, a skill that is central in many school subjects. The findings are promising, showing that even untrained teachers seem able to interpret gaze displays of reading assignments to some extent. Training and guidelines could be developed to aid teachers in the interpretation of gaze displays as many teachers mentioned that they would like to know more about how to interpret gaze displays. Although future research is needed (e.g., on optimal display design, impact of gaze displays on teachers’ actions in practice, and consecutive on student achievement), our results suggest that in the near future, gaze displays may indeed be used to support teachers in determining which reading strategy a student uses, information that cannot easily or reliably be retrieved another way. Although eye tracking technology is at present not yet widely available to schools, this can be expected to change in the near future, as low-cost webcam-based eye tracking solutions are being developed that can be used with regular laptops with camera-function (e.g., Madsen et al., 2021) and the quality of such build-in cameras increases swiftly. It is thus certainly plausible that in the near future, students’ eye movements can be tracked during reading tasks (or other learning tasks) and that information on their eye movements can be visualized for teachers and used in educational practices.
This study provides first insights into how teachers interpret gaze displays as a form of learning analytics in educational practice. Earlier literature showed that gaze displays can be interpreted in terms of the search target, viewing task, preference, or answer to a multiple-choice question (Bahle et al., 2017; Emhardt et al., 2020; Foulsham & Lock, 2015; Van Wermeskerken et al., 2018; Zelinsky et al., 2013). Our results add to and extend findings from earlier research by showing that gaze displays of reading strategies can be meaningfully interpreted by teachers, which is arguably a substantially more complex task than making inferences about people’s objects or answer preferences from gaze displays.
Teachers’ remarks about what they saw in the gaze displays (awareness phase) mostly overlapped with the actual pattern of eye-tracking data. We found that teachers interpreted reading strategies in the gaze displays (interpretation phase) quite well, and also interpreted them as reflecting other concepts, such as motivation and concentration. Teachers based their initiated actions on the gaze displays (enactment phase). Participants were generally positive about using gaze displays in education, both to inform themselves as well as feedback for students, although they mentioned practical issues and a need for more information as areas for improvement.
To conclude, gaze displays in reading education seem to be a promising form of learning analytics in education, by providing teachers insight into the reading process of their students, and teachers seem to be willing to incorporate gaze displays in their (future) education. Future research should further explore the possibilities of the use of gaze displays in educational practice.
*Shared first authorship
** Authors contributed equally
1Krippendorffs Alpha was calculated using the KALPHA macro in SPSS at the nominal measurement level (Hayes & Krippendorff, 2007) because it enables the inclusion of four coders.
2Note that Krippendorffs alpha is sensitive to low-prevalent scores, especially with binary variables (like our enactment codes). In this study, almost all codes have low-prevalent scores. So, in combination with the high percentage overlap, we consider the reliability acceptable.
Afflerbach, P., Pearson, P. D., & Paris, S. G. (2008).
Clarifying differences between reading skills and reading
strategies. The Reading Teacher, 61(5),
364-373. https://doi.org/https://doi.org/10.1598/RT.61.5.1
Almosallam, E. A., & Ouertani, H. C. (2013). Learning
analytics: Definitions, applications and related fields.
Proceedings of the first international conference on advanced data
and information engineering (DaEng-2013),
Andreassen, R., Jensen, M. S., & Bråten, I. (2017).
Investigating self-regulated study strategies among postsecondary
students with and without dyslexia: A diary method study. Reading
and Writing, 30(9), 1891-1916. https://doi.org/10.1007/s11145-017-9758-9
Bahle, B., Mills, M., & Dodd, M. D. (2017). Human classifier:
Observers can deduce task solely from eye movements. Attention
Perception & Psychophysics, 79(5), 1415-1425.
https://doi.org/10.3758/s13414-017-1324-7
Benfatto, M. N., Öqvist Seimyr, G., Ygge, J., Pansell, T.,
Rydberg, A., & Jacobson, C. (2016). Screening for dyslexia
using eye tracking during reading. Plos One, 11(12),
e0165508.
https://doi.org/10.1371/journal.pone.0165508
Böhm, M. (2021, September 14). Lesediagnostik und
Leseförderung. https://www.lesediagnostik.de/
Chisari, L. B., Mockevičiūtė, A., Ruitenburg, S. K., van Vemde,
L., Kok, E. M., & van Gog, T. (2020). Effects of prior
knowledge and joint attention on learning from eye movement
modelling examples. Journal of Computer Assisted Learning,
36(4), 569-579. https://doi.org/10.1111/jcal.12428
De Koning, B. B., & Jarodzka, H. (2017). Attention guidance
strategies for supporting learning from dynamic visualizations. In
R. Lowe & R. Ploetzner (Eds.), Learning from Dynamic
Visualization: Innovations in Research and Application
(pp. 255-278). Springer International Publishing. https://doi.org/10.1007/978-3-319-56204-9_11
Donovan, T., Manning, D. J., & Crawford, T. (2008).
Performance changes in lung nodule detection following
perceptual feedback of eye movements. Proceedings of SPIE
- The International Society for Optical Engineering in San Diego,
CA, http://dx.doi.org/10.1117/12.768503
Duffy, G. G. (2002). The case for direct explanation of
strategies. In C. C. Block & M. Pressley (Eds.), Comprehension
instruction: Research-based best practices (pp. 28-41).
Guilford.
Duke, N. K., & Pearson, P. D. (2009). Effective practices for
developing reading comprehension. Journal of education,
189(1-2), 107-122. https://doi.org/10.1177/0022057409189001-208
Eder, T. F., Richter, J., Scheiter, K., Keutel, C., Castner, N.,
Kasneci, E., & Huettig, F. (2020). How to support dental
students in reading radiographs: effects of a gaze based compare
and contrast intervention. Advances in Health Sciences
Education: Theory and Practice. https://doi.org/10.1007/s10459-020-09975-w
Emhardt, S. N., van Wermeskerken, M., Scheiter, K., & van Gog,
T. (2020). Inferring task performance and confidence from displays
of eye movements. Applied Cognitive Psychology, 34(6),
1430-1443. https://doi.org/https://doi.org/10.1002/acp.3721
Ericsson, K. A., & Simon, H. A. (1993). Protocol
analysis: Verbal reports as data. MIT Press. http://books.google.nl/books?id=z4HQQgAACAAJ
Foulsham, T., & Lock, M. (2015). How the eyes tell lies:
Social gaze during a preference task. Cognitive science,
39(7), 1704-1726. https://doi.org/10.1111/cogs.12211
Gambrell, L. B., Malloy, J. A., & Mazzoni, S. A. (2011).
Evidence-based best practices for comprehensive literacy
instruction. In L. M. Morrow & L. B. Gambrell (Eds.), Best
practices in literacy instruction (fourth edition) (Vol. 4,
pp. 11-56). The Guilford Press.
Guthrie, J. T., & Mosenthal, P. (1987). Literacy as
multidimensional: Locating information and reading comprehension.
Educational Psychologist, 22(3-4), 279-297. https://doi.org/10.1080/00461520.1987.9653053
Hayes, A. F., & Krippendorff, K. (2007). Answering the call
for a standard reliability measure for coding data. Communication
Methods and Measures, 1(1), 77-89. https://doi.org/10.1080/19312450709336664
Henneman, E. A., Cunningham, H., Fisher, D. L., Plotkin, K.,
Nathanson, B. H., Roche, J. P., Marquard, J. L., Reilly, C. A.,
& Henneman, P. L. (2014). Eye tracking as a debriefing
mechanism in the simulated setting improves patient safety
practices. Dimensions of Critical Care Nursing, 33(3),
129-135.
https://doi.org/10.1097/DCC.0000000000000041
Jarodzka, H., van Gog, T., Dorr, M., Scheiter, K., & Gerjets,
P. (2013). Learning to see: Guiding students' attention via a
model's eye movements fosters learning. Learning and
Instruction, 25 (0), 62-70. https://doi.org/10.1016/j.learninstruc.2012.11.004
Jivet, I., Scheffel, M., Drachsler, H., & Specht, M. (2017).
Awareness is not enough: Pitfalls of learning analytics dashboards
in the educational practice. European Conference on Technology
Enhanced Learning, Tallinn, Estonia.
Katalayi, G. B., & Sivasubramaniam, S. (2013). Careful reading
versus expeditious reading: Investigating the construct validity
of a multiple-choice reading test. Theory and Practice in
Language Studies, 3, 877-884. https://doi.org/10.4304/tpls.3.6.877-884
Knoop-van Campen, C. A. N., Doest., D. ter, Verhoeven, L., &
Segers, E. (2021). The effect of audiosupport on strategy, time,
and performance on reading comprehension in secondary school
students with dyslexia. Annals of Dyslexia, 1-20
Knoop-van Campen, C. A. N. & Molenaar, I. (2020). How teachers
integrate dashboards into their feedback practices. Frontline
Learning Research, 8(4), 37-51. https://doi.org/10.14786/flr.v8i4.641
Knoop-van Campen, C. A. N., Wise, A., & Molenaar, I. (2021).
The equalizing effect of teacher dashboards on feedback in K-12
classrooms. Interactive Learning Environments, 1-17. https://doi.org/10.1080/10494820.2021.1931346
Kok, E. M., Aizenman, A. M., Võ, M. L.-H., & Wolfe, J. M.
(2017). Even if I showed you where you looked, remembering where
you just looked is hard. Journal of Vision, 17(12),
1-11. https://doi.org/10.1167/17.12.2
Kostons, D., van Gog, T., & Paas, F. (2009). How do I do?
Investigating effects of expertise and performance-process records
on self-assessment. Applied Cognitive Psychology, 23(9),
1256–1265. https://doi.org/10.1002/acp.1528
Krishnan, K. S. D. (2011). Careful versus expeditious reading: The
case of the IELTS reading test. Academic Research
International, 1(3), 25.
Liu, F. (2010). Reading abilities and strategies: A short
introduction. International Education Studies, 3(3),
153-157. https://doi.org/10.5539/ies.v3n3p153
Madsen, J., Julio, S. U., Gucik, P. J., Steinberg, R., &
Parra, L. C. (2021). Synchronized eye movements predict test
scores in online video education. Proceedings of the National
Academy of Sciences, 118(5). https://doi.org/10.1073/pnas.2016980118
Mason, L., Pluchino, P., & Tornatora, M. C. (2015).
Eye-movement modeling of integrative reading of an illustrated
text: Effects on processing and learning. Contemporary
Educational Psychology, 41, 172-187. https://doi.org/10.1016/j.cedpsych.2015.01.004
Molenaar, I., & Knoop-van Campen, C. (2019). How teachers make
dashboard information actionable. IEEE Transactions on
Learning Technologies, 12(3), 347-355. https://doi.org/10.1109/TLT.2018.2851585
Murnane, R., Sawhill, I., & Snow, C. (2012). Literacy
challenges for the twenty-first century: Introducing the issue. The
Future of Children, 3-15. https://doi.org/10.1353/foc.2012.0013
Oudman, S., van de Pol, J., Bakker, A., Moerbeek, M., & van
Gog, T. (2018). Effects of different cue types on the accuracy of
primary school teachers' judgments of students' mathematical
understanding. Teaching and Teacher Education, 76,
214-226.
https://doi.org/https://doi.org/10.1016/j.tate.2018.02.007
Pikulski, J. J., & Chard, D. J. (2005). Fluency: Bridge
between decoding and reading comprehension. The Reading
Teacher, 58(6), 510-519. https://doi.org/10.1598/RT.58.6.2
Rienties, B., Herodotou, C., Olney, T., Schencks, M., &
Boroowa, A. (2018). Making sense of learning analytics dashboards:
A technology acceptance perspective of 95 teachers.International
Review of Research in Open and Distributed Learning,
19(5). https://doi.org/10.19173/irrodl.v19i5.3493
Rosengrant, D., Hearrington, D., & O’Brien, J. (2021).
Investigating Student Sustained Attention in a Guided Inquiry
Lecture Course Using an Eye Tracker. Educational Psychology
Review, 33(1), 11-26. https://doi.org/10.1007/s10648-020-09540-2
Salmerón, L., Naumann, J., García, V., & Fajardo, I. (2017).
Scanning and deep processing of information in hypertext: An eye
tracking and cued retrospective think‐aloud study. Journal of
Computer Assisted Learning, 33(3), 222-233. https://doi.org/10.1111/jcal.12152
Scheiter, K., Schubert, C., & Schüler, A. (2018).
Self-regulated learning from illustrated text: Eye movement
modelling to support use and regulation of cognitive processes
during learning from multimedia. British Journal of
Educational Psychology, 88(1), 80-94. https://doi.org/doi:10.1111/bjep.12175
Schutz, K. M., & Rainey, E. C. (2020). Making sense of
modeling in elementary literacy instruction. The Reading
Teacher, 73 (4), 443-451. https://doi.org/10.1002/trtr.1863
Shute, V. J., & Zapata-Rivera, D. (2012). Adaptive educational
systems. In P. J. Durlach & A. Lesgold (Eds.), Adaptive
technologies for training and education (Vol. 7, pp. 1-35).
Cambridge University Press. https://doi.org/10.1017/CBO9781139049580.004
Špakov, O., Siirtola, H., Istance, H., & Räihä, K. (2017).
Visualizing the reading activity of people learning to read. Journal
of Eye Movement Research, 10(5), 1-12. https://doi.org/10.16910/jemr.10.5.5
Tijmstra, J., & Boeije, H. (2011). Wetenschapsfilosofie
in de context van de sociale wetenschappen. Boom Lemma.
Urquhart, S., & Weir, C. (1998). Reading in a Second
Language: Process, Product and Practice. Routledge.
Van de Pol, J., de Bruin, A. B. H., van Loon, M. H., & van
Gog, T. (2019). Students’ and teachers’ monitoring and regulation
of students’ text comprehension: Effects of comprehension cue
availability. Contemporary Educational Psychology,
56, 236-249. https://doi.org/10.1016/j.cedpsych.2019.02.001
Van de Pol, J., Van den Boom-Muilenburg, S. N., & Van Gog, T.
(2021). Exploring the relations between teachers’ cue-utilization,
monitoring and regulation of students’ text learning. Metacognition
and Learning, 1-31.
Van Gog, T., & Jarodzka, H. (2013). Eye tracking as a tool to
study and enhance cognitive and metacognitive processes in
computer-based learning environments. In R. Azevedo & V.
Aleven (Eds.), International Handbook of metacognition and
learning technologies (pp. 143-156). Springer Science+
Business media.
Van Gog, T., Jarodzka, H., Scheiter, K., Gerjets, P., & Paas,
F. (2009). Attention guidance during example study via the model’s
eye movements. Computers in Human Behavior, 25(3),
785-791. https://doi.org/10.1016/j.chb.2009.02.007
Van Leeuwen, A. van, Knoop-van Campen, C. A. N., Molenaar, I.,
& Rummel, N. (2021). How teacher characteristics relate to how
teachers use dashboards: Results from two case studies in K-12. Journal
of Learning Analytics, 8(2), 6-21. https://doi.org/10.18608/jla.2021.7325
Van Leeuwen, A., Rummel, N., & van Gog, T. (2019). What
information should CSCL teacher dashboards provide to help
teachers interpret CSCL situations? International Journal of
Computer-Supported Collaborative Learning , 14(3),
261-289. https://doi.org/10.1007/s11412-019-09299-x
Van Wermeskerken, M., Litchfield, D., & van Gog, T. (2018).
What am I looking at? Interpreting dynamic and static gaze
displays. Cognitive Science, 42(1), 220-252. https://doi.org/10.1111/cogs.12484
Verbert, K., Govaerts, S., Duval, E., Santos, J. L., Van Assche,
F., Parra, G., & Klerkx, J. (2014). Learning dashboards: An
overview and future research opportunities. Personal and
Ubiquitous Computing, 18(6), 1499-1514. https://doi.org/10.1007/s00779-013-0751-2
Võ, M. L. H., Aizenman, A. M., & Wolfe, J. M. (2016). You
think you know where you looked? You better look again.
Journal of Experimental Psychology: Human Perception and
Performance , 42(10), 1477-1481. https://doi.org/10.1037/xhp0000264
Xhakaj, F., Aleven, V., & McLaren, B. M. (2017). Effects of a
teacher dashboard for an intelligent tutoring system on teacher
knowledge, lesson planning, lessons and student learning. European
Conference on Technology Enhanced Learning,
Zelinsky, G. J., Peng, Y., & Samaras, D. (2013). Eye can read
your mind: Decoding gaze fixations to reveal categorical search
targets. Journal of Vision
, 13 (14), 1-13. https://doi.org/10.1167/13.14.10
Codebook and detailed overview coding process
For awareness, we coded whether teachers mentioned that the student looked at or paid attention to the separate AOIs (i.e., title, subheadings 1 and 2, section 1, 2, 3, and the image). A score of 1 was given if the teacher mentioned that the student looked (a lot) at this part of the stimulus, and a score of -1 was given if the teacher mentions that the student did not look at this part of the stimulus (also if the teacher mentioned ‘missing’, ‘looking only a little bit at’). In addition to the AOIs, we also coded looking at ‘everything’, ‘important words/sentences’, ‘rereading’ with scores 1 and -1. If a code was not mentioned or if, in rare cases, both scores could be applied, the score 0 (missing value) was applied.
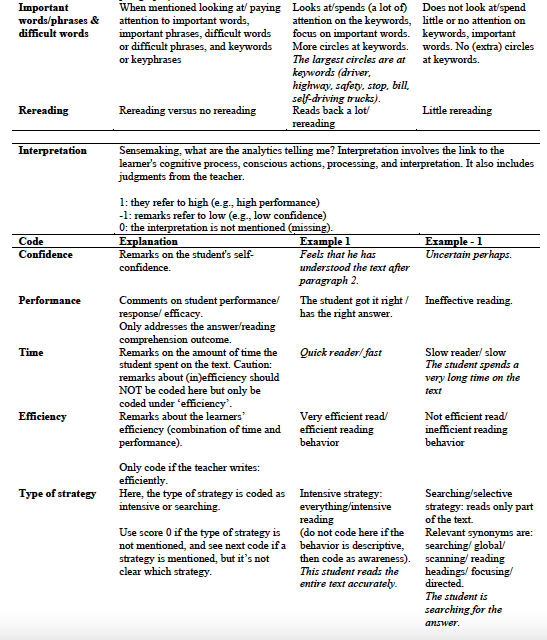
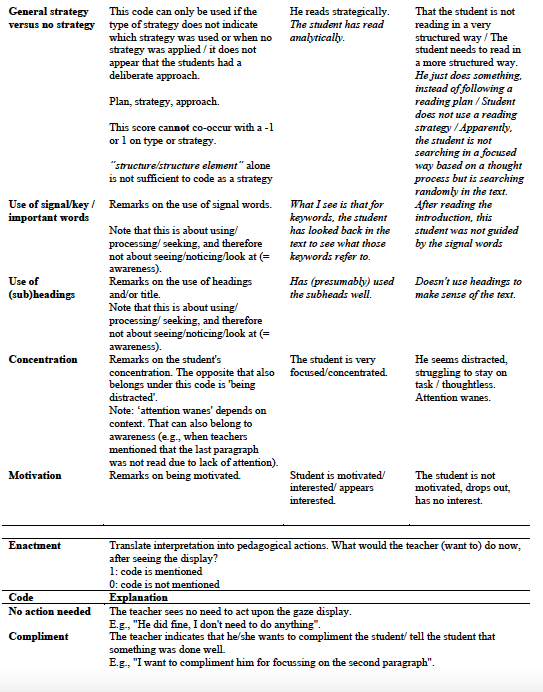
A similar approach was used for interpretation, but here 1 refers to high (e.g., high performance) and -1 refers to low (e.g., low confidence). These scores were used for ‘confidence’, ‘performance’, ‘reading time’, ‘efficiency’, ‘use of signal words’, ‘use of headings’, ‘concentration’, and ‘motivation’. Note that for reading time, score 1 refers to quick reading and score -1 refers to slow reading. Finally, the type of strategy was scored as intensive, selective, general (any strategy, but unclear which strategy), or no strategy.
For enactment, the form of contrast described above was not possible, so for those codes, only 1 (code mentioned) or 0 (code not mentioned) were scored. The codes were ‘no action is needed’, ‘give a compliment’, ‘provide instruction (in the form of an explanation / modelling / another form)’, ‘adapt the assignment’, ‘need more information (from a conversation with student / the performance / other information)’, ‘I do not know how to act on this’, ‘other actions’. To make contrasting codes, we additionally recoded codes into ‘any action’ (any form of enactment mentioned) versus ‘no action’ (teacher writes that no action is needed or only the action ‘give a compliment’).
Instructions awareness, interpretation, and enactment
Code the three questions together, i.e., codes for awareness can also be scored if this information is provided in the second question. Code what is actually said and avoid making inferences, i.e., do not code ‘everything’ if a participant summed up all different parts, but only if the person actually said that ‘everything’ was read.
For awareness and interpretation, two scores are available: -1 and 1. Score 0 if this code is not mentioned (missing value). Score -1 if the negative form (see definitions) is mentioned and 1 if the positive form (see definitions) is mentioned. If something is mentioned, but it is unclear whether -1 or 1 should be coded, score as 0. For Enactment, only 0 (not mentioned) and 1 (mentioned) are possible.
If a person refers back to a previous answer, simply code that as everything not mentioned (as it is impossible to know which aspects of the other answer the person refers to).
All codes are identical for displays X, Y, and Z.
Codebook
Actual quotes as examples are italicized. Translations to Dutch can be found in brackets.