![]()
Frontline Learning Research Vol.9 No. 3 (2021) 31
- 51
ISSN 2295-3159
1Institute for Children and
Youth Education, Educational Sciences, University of Koblenz and
Landau, Landau, Germany
Article received 2 September 2020 / revised 10 January 2021 / accepted 4 March / available online 25 May
The emotions experienced by primary school students have both positive and negative effects on learning processes. Thus, to better understand learning processes, research should consider emotions during class. Standard survey-based methods, such as self-reports, are limited in terms of capturing the detailed trajectories of primary school children’s emotions, as their abilities of self-reporting are developing and still limited. Emotions can also be tracked by capturing emotional responses as they occur e.g. from physiological reaction measured with sensor wristbands. This technology generates an emotional responses typology based on continuously captured physiological data, such as skin conductivity and skin temperature. However, such measurement methods need to be validated before being used. The present study thus attempted to validate this instrument with primary school students. We used the BM Sensor Wristband technology, as its emotional response typology is based on the categorical emotion and homeostasis approach. In our research, we focus on the emotional responses that can be distinguished by the BM Typology and that can influence learning processes. These emotional responses are: “joy”, “curiosity”, “attention”, “fear”, “anger” and “passivity”. Therefore, we induced emotional responses in primary school children through specifically developed audio-visual stimuli. Using logistic mixed effects modelling, we investigated the occurrence of opposing reactions. We observed that primary school children’s reactions to audio-visual stimuli could be differentiated. We conclude that primary school children’s emotional responses, such as “joy”, “curiosity”, “attention”, “fear”, “anger” and “passivity”, can be accurately measured by evaluating physiological data.
Keywords: Emotional Responses; Primary school children; Physiological Data; Sensor Wristband
Emotions are a foundation for cognitive resources, learning strategies, self-regulation, learning performance and learning motivation, thus, emotional experiences are closely related to learning processes (Ahmed et al., 2013; Tyng et al., 2017). Emotions relevant to the generation of knowledge (epistemic emotions) and learning (achievement emotions) include enjoyment, anxiety, anger, boredom and curiosity (Pekrun & Stephens, 2012; Pekrun & Linnenbrink-Garcia, 2012). Although, according to Pekrun (2017), attention is not considered as an emotion, it is crucial for fundamental processes of engagement in learning (Steinmayr et al., 2010; Posner & Rothbart, 2005).
Emotions are mostly surveyed using questionnaires, such as standardized self-report scales (Pekrun & Bühner, 2014). This measurement approach, which has been used successfully, seems to have its limits when it comes to capturing emotions at the moment they emerge. First, students who are to report on their overall perceived emotional experiences evaluate their emotions retrospectively. In these retrospective analyses, subjects are asked to remember a situation in which they experienced these emotions. Such sources are submitted to selective memory. Events and considerations that occur between the originally experienced emotion and the remembered emotion can lead to a differing evaluation (Moosbrugger & Kelava, 2012). In addition, participants often state the sum of their experiences, although fluctuations may occur during the process itself (Brandstätter et al., 2018). Thus, it is difficult to capture emotions in detail in the course of learning processes (D´Mello et al., 2007; Lohrmann, 2008). Moreover, capturing primary school students’ emotions during learning must take into account children’s limited working memory. Hence, it may be even more difficult to measure and classify emotional experiences by classical survey methods, such as questionnaires (Turner & Trucano, 2014). Consequently, we must find a way to capture emotional experiences not only retrospectively but additionally also during learning in order to analyse the fluctuation of emotions more closely (Linnenbrink-Garcia et al., 2016).
Therefore, we could use measuring devices that go beyond self-reports (Järvela et al., 2010; Paris & Turner, 1994; Winne & Perry, 2000). Recent emotion research has developed instruments that offer a solution for measuring emotional reactions using physiological data in real time without self-report bias. Various manufacturers offer devices for tracking physiological data, with the possibility to use this information for the recognition of emotional reactions. Although these analyses always remain interpretive, such evaluations could contribute to emotion analysis. Järvenoja et al. (2018) captured skin conductivity using the Empatica E4 wristband (Empatica Inc., Cambridge, MA) to analyse the intensity of emotional responses in cooperative learning situations. The Empatica device is focused on providing physiological parameters like skin conductivity or heart rate to indicate arousal changes. However, it does not provide indicators for the interpretation of physiological data in emotional terms like fear or joy, relevant in school achievement research.
Another device that captures emotional responses through physiological reactions is the Sensor Wristband from Bodymonitor. In contrast to the Empatica E4 wristband, the BM Sensor Wristband offers, according to the manufacturer, an emotion classification of physiological data. Thus, we examine emotions that are part of the BM repertoire, which allows to identify high arousal responses such as appetitive arousal (“joy”/“curiosity”) and aversive arousal (“fear”/“anger”), as well as low arousal responses such as deactivation (“passivity”) and homeostasis (“attention”). In addition, the wristband can be adjusted to different wrist sizes of children. In the following, we examine the theoretical foundation of these emotions.
In emotion research, two dominant approaches describe the generation of emotions, namely the categorical (Ekman, 1999; Panksepp, 1982) and the dimensional theory of emotions (Barrett, 2006; Pekrun, et al., 2014; Russell, 1980; Scherer, 1999). Both approaches see emotional reactions as a result of the brain's appraisal processes of external and internal stimuli. In the dimensional approach, the appraisal process leads to a subjective, positive or negative evaluation of the stimuli and thus, emotional labelling depends on subjective interpretation.
In the categorical approach, it is assumed that there are separate basic appraisal-response sets (also called emotional responses) that have evolved as functional systems for survival in an evolutionary process. Although there is no consensus on how many elementary emotional responses there are (Von Scheve, 2014), they are supposed to encompass a) high-arousal responses, which have appetitive and aversive aspects, and b) low-arousal responses (Lee & Lang, 2009; Oxendine, 1970). A) High-arousal responses include emotions such as fear, joy, anger and surprise (Piórkowska & Wrobel, 2017; Zillmann, 2008), which are also referred to as basic emotions according to Ekman and Cordaro (2011). B) According to Levenson (2006), low arousal responses include homeostasis, where the body is generally alert and physiological responses are balanced, which can be understood as attention. Furthermore, low arousal responses include deactivation, where the central nervous system withdraws when no other emotional responses occur for a period of time, this can be understood as passivity.
There is consensus that emotional responses are automatic, continuous neural evaluative processes (Izard, 1993; Lang & Bradley, 2010; LeDoux, 1998; Ortony & Turner, 1990), that unfold in multiple dimensions, namely as changes in physiological data (skin conductivity, skin temperature, heart rate) and musculoskeletal systems (posture, gestures, facial expressions). Moreover, these physiological responses are supposed to effect motivational tendencies and subjective feelings (Levenson, 2003, 2014). Changes in skin conductivity, skin temperature and heartrate can signify a wide variety of neurophysiological processes, such as the level of arousal (high and low) (Kołodziej et al., 2019) and the quality of arousal (appetitive or aversive) (Hayes et al., 2014). Thus, their measurement may give insights into various emotions.
The emotional responses that can be captured by the BM Sensor Wristband via physiological data play an important role in learning research. Some students learn successfully, while others have difficulties developing and activating resources to be academically successful (Pintrich, 2003) Positive predictors of learning are joy, curiosity and attention. Joy is one of the basic emotions that arise as a reaction to a pleasant situation (Ekman, 1982). Joy in learning can enable children to focus their attention on the task at hand and thus promote deep immersion in the learning content (Roth, 2011; Sturm, 2005). Hascher & Brandenberger (2018) examined the effectiveness of computer-assisted individualization in teaching mathematics on the performance and emotions of fifth-grade students. These researchers observed that learning progress triggered joy and that joy, in turn, had a positive effect on learning progress. Curiosity can be defined as an intrinsic desire to acquire new knowledge and sensory information (Engel, 2011). For example, Eren & Coskun (2016) have shown that curiosity, which reflects an “urge to know”, is significantly linked to university students' learning, commitment, performance goals, and knowledge acquisition and a deeper understanding of the knowledge content. Finally, attention is a decisive factor for learning because it enables students to engage with learning content in the first place (Brünken & Seufert, 2006). Jamet et al. (2008) showed that directing attention through the use of typographic highlighting facilitates the learning of vocabulary by undergraduate students.
Negative predictors of learning are fear, anger and passivity (Eren & Coskun, 2016; Götz et al., 2007; Mulryan, 1992). Fear is one of the basic emotions that arises when a threat of harm appears, whether physical or psychological, real or imagined (Ekman, 1982). In learning, fear can have a negative effect because it is associated with the use of rigid strategies that lose themselves in detail and do not promote creative, independent and holistic learning (Götz et al., 2007). Students report that of all negative emotions, they experience anxiety most often (Pekrun et al., 2002), which is closely related to fear (Horwitz, 2013). Eysenck et al. (2005) showed that undergraduate students with high anxiety levels had significantly poorer access to their memory systems for task processing and made significantly more mistakes than the group with low anxiety levels. Anger is one of the basic emotions that arises when we are prevented from pursuing a goal and/or treated unfairly (Ekman, 1982). Anger may arise whenever obstacles to learning occur that students perceive as unnecessary or arbitrary, which may be the case if performance requirements are perceived to be too high or if performance assessments are not comprehensible. To summarize, anger in learning can lead to task-irrelevant thinking and hinder interest, intrinsic motivation and self-regulated learning (Pekrun, 2018). In a survey with undergraduate students, Pekrun et al. (2011) showed that anger correlated negatively with intrinsic motivation, elaboration and self-regulation. Furthermore, anger correlated negatively with students' overall self-reported learning efforts and academic achievement. Finally, passivity is related to off-task behaviour in learning and thus hinders learning (Riley et al., 2011). Mulryan (1992) showed, in a study of cooperative small group teaching in mathematics with primary school children, that especially low-performing children showed a high degree of passive behaviour in class. According to (Sidelinger & Booth-Butterfield, 2010) engagement in class should be encouraged instead of passivity, in order to increase students' learning success.
Thus, exploring emotional responses such as appetitive arousal (“joy”/“curiosity”) and aversive arousal (“fear”/“anger”), as well as deactivation (“passivity”) and homeostasis (“attention”) with the BM Sensor Wristband might give valuable insights into students’ emotions during learning. However, the use of sensor wristbands might be viewed critically (Endedijk et al., 2018). This is particularly important if learning processes are to be analysed in authentic environments. For example, teacher`s praise might be a more or less positive stimulus for students depending on teacher, task, social context, personal thoughts, peer behaviour and physical needs. Therefore, it is necessary to determine what triggers emotional responses in order to analyse physiological reactions. Moreover, movement of wrists or arms might drown the measurement of physiological reactions with young students who tend to move more intensely than adults. Since the measurement is based on the function of the sweat glands, physiological differences between adults and children may occur (Falk, 1998). Accordingly, such devices should be tested in advance with regard to their use and the transferability of the measurement procedure from adults to young children. Additionally, testing such devices are a first step towards their implementation in authentic learning settings. Therefore, we conducted a study in which we validated the use of the BM Sensor Wristband on primary school children.
In our study, we have targeted at evoking the emotional responses "curiosity", "passivity", "attention", "anger", "joy" and "fear" with different stimuli. We coupled "curiosity" with "passivity", "attention" with "anger" and "joy" with "fear" according to the manufacturer's suggestion in order to check whether the probability of one of the emotional responses occurring during the respective stimulus is higher than during a reference stimulus. Furthermore, these comparisons are also be supported by literature. Studies on learning situations have shown that
Can primary school children’s emotional responses be accurately measured using physiological data with the BM Sensor Wristband?
We hypothesize that when comparing two contrasting emotional responses, the probability of occurrence of the induced response is higher than in the non-induced response.
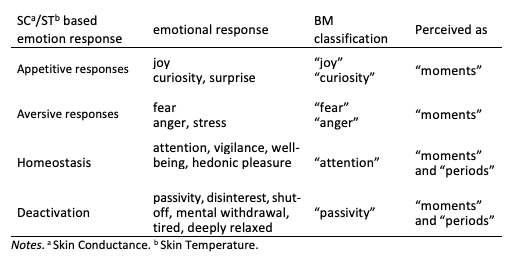
Based on the categorial emotion theory (Levenson, 2011; Panksepp & Watt, 2011), the BM technology generates a typology of six different emotional responses based on continuously captured physiological data, such as skin conductivity and skin temperature, via a sensor wristband (Figure 1). The emotional response typology categories (Table 1) include appetitive responses: “joy”, “curiosity” and aversive responses: “fear”, “anger”), homeostasis (“attention”) and deactivation (“passivity”). Appetitive and aversive responses (“joy”, “curiosity”, “fear” and “anger”) are typically short-term reactions (Ekman, 1999, Martinent et al., 2012); therefore, data on the occurrence (“moments”) can be recorded. The homeostasis and deactivation responses (“attention” and “passivity”) are sequential episodes that can be classified after a certain period of time (Jänig, 2008). Therefore, for “attention” and “passivity” the duration (“periods”) must also be recorded.
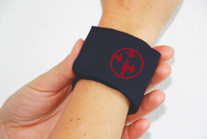
Figure 1 BM Sensor Wristband.
Table 1
BM typology of emotional responses.
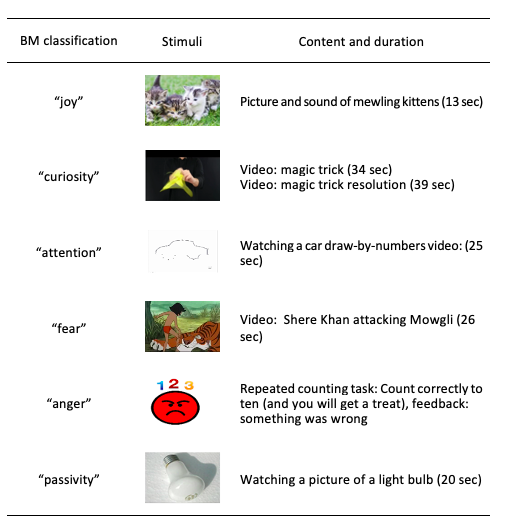
Validated stimuli, such as those defined by the International Affective Digitized Sounds (IADS-2) and the International Affective Picture System (IAPS) and the Geneva Affective Picture Database (GAPED), could not be employed because these stimuli were developed by using responses of the adult population. Since the participants in this study were primary school students, the stimuli had to be adapted to their age and stage of development (see Table 2). The adapted stimuli were evaluated by 25 adult experts. Each expert was presented with a selection of various stimuli on a screen in a quiet room. Each example was then rated for its supposed effect on emotional responses in children of primary school age. In addition, 12 children (M = 8.9, SD = 1.34, 67% female) were interviewed regarding their occurring emotions when monitoring the stimuli. In this way, their physical reactions, such as facial expressions and gestures, could also be evaluated. This selection procedure resulted in the stimuli listed in Table 2. Finding stimuli for anger and fear was particularly challenging. To provoke anger, we had a stimulus in which the children were promised a gift that they ended up not receiving. However, this led to sadness and disappointment rather than anger. It was only when we inserted the repetitive counting task that the students reported perceived anger. To provoke fear, we told the children a scary story with spooky pictures. However, this story generated many laughs and thus rather joy instead of fear. Thus, we developed a video clip showing Shere Khan attacking Mowgli and evaluated the reaction by the 25 adult experts and the 12 children. Based on their feedback, we decided to use this fear stimulus instead.
Table 2
Overview of the stimuli
This study used repetitive measurements and was initially conducted with children of the first to fourth grade children, which corresponds to the four years of primary school in Germany (Sample 1). Subsequently, as a validation and specification of these results, we repeated the study with third and fourth grade children (Sample 2). Standard procedures were used for recruiting participants: Written informed consent, approved by the university institutional review board and the school board, was obtained from the parents of each participant. Students were drawn from 6 primary schools in rural Germany. Participation in the study was voluntary, and the students were able to revoke their consent at any time during the course.
Sample 1 consisted of 113 children between 5.2 and 11.4 years of age (M = 8.7, SD = 1.12, 58% female). Sample 2 consisted of 164 children between 8.1 and 11.2 years of age (M = 9.9, SD = .66, 56.7% female).
The study was conducted in a classroom in the primary school
that the children attended. The students’ desks and chairs were
arranged in rows. Two workplaces that were separated through
blinds were assembled on each table, so that each child was as
undisturbed as possible. Each workplace consisted of a tablet PC,
a BM Sensor Wristband, and headphones. A group of maximum 10
students each were welcomed into the classroom and assigned to a
workplace. Next, the sensor wristbands were strapped on. The
children were told that they would be playing a computer game with
different tasks and that they would receive candy as a reward.
Before the game was started, the teacher explained the different
tasks and ensured that everyone understood. It was also made clear
that when the children were finished, they would have to remain
quietly at their places until everyone had finished. Since the
school staff was informed about the implementation of the study,
the survey was not disturbed from outside. If a child needed help,
the child was spoken to very quietly at the workplace as not to
disturb others. This was noted in the study protocol. If a child
needed substantial help (more than once), the data was not
included in the study (sample 1: 2 cases; sample 2: 0 cases). To
start, the children put on headphones and opened the app on the
tablet PC. Although the children worked in parallel, each worked
at their own pace according to how quickly they completed each
task. The stimuli were presented in the following order to mix the
expected positive and negative emotional responses:
1. “curiosity” (magic trick)
2. “passivity” (light bulb)
3. “fear” (Shere Khan is attacking Mowgli)
4. “joy” (mewling kittens)
5. “anger” (repeated counting)
6. “attention” (car draw-by-numbers)
Moreover, each stimulus was followed by a flower/balloon/fish draw-by-numbers video with the aim of avoiding spill-over effects over consecutive emotional responses and to re-establish attention and the baseline.
According to Nakasone et al. (2005), acquiring and analysing physiological data always faces the so-called baseline problem. The baseline problem implies that it is difficult to identify a response (the baseline) to which physiological changes can be compared. Therefore, the event-related skin conductance responses (SCR values) were first transformed into phi values using the transformation procedure for area correction (Lykken, 1972) in order to compare the responses of different subjects. Afterwards, the current SCR reaction intensity was calculated. These express the average increase in skin conductivity per unit of time (i.e. per second). The data could then be reduced to response peaks (local maxima) in an individual response curve.
The BM Sensor Wristband acquired the physiological data. The original wristband has been adapted for usage with children (Figure 2). The overall size of the wristband was reduced, as it was originally developed to fit adults’ wrists. In addition, the length of the wristband can be extended to fit wrists of different sizes. A child-friendly fabric was employed for the complete wristband (textile housing and extension). By wearing the wristband, the following parameters were captured at a 10-Hz rate: skin conductance, skin temperature, ambient temperature, 3-dimensional acceleration, and pressure force on electrodes. This raw data was stored locally on the SD card of the wristband.
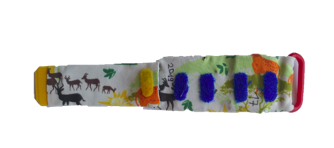
Figure 2. Child-compatible BM Sensor Wristband.
By using two different kinds of electronic devices (tablet PC and sensor wristband), two types of data was generated:
a) Subjective choice data via normal computer-human interaction of the developed application. For each child, the interaction with the tablet PC application was automatically protocolled in a data matrix with one line for each action. Each action was time stamped.
b) Physiological parameter data in tab-delimited ASCII format. As the capture rate was 10 Hz, the data matrix consisted of one line for each reading, which means that one second of data collection led to 10 observation lines. As children wore the wristband for 45 minutes, one block of emotional response induction was recorded for a duration of 45 minutes, which resulted in 45*60*10 = 27 000 observations. After automated purge of changing contact quality related artefacts, skin conductance and skin temperature were used to reach a classification according to the BM emotional responses classification system. BM automatically applied its algorithm and, using interval wise regressions, provided a dataset where raw physiological reaction data were replaced by ratio-scaled scores of emotional responses, such as “joy”, “curiosity”, fear” and “anger”, as well as binary information regarding “attention” and/or “passivity”, given on a moment-by-moment basis. However, due to the manufacturer, we are not able to present the algorithm.
As both the tablet PC application data and wristband parameter data were time-stamped, data could then be merged via corelating timestamps. This approach enabled the analysis of the physiological data by intervals, which were characterized by their concurrent stimulus presentation. If technical errors occurred, for example, if there was an instruction or application error or time stamps were missing, these cases were excluded from the analyses (sample 1:4 cases; sample 2:13 cases).
To evaluate the validity of the BM emotional responses classification, statistical analyses were performed by contrasting the outcomes of emotional response classification for the inductive stimulus interval with the classification outcome for a reference stimulus interval.
Hence, we used the following contrasts:
For the emotional responses “joy”, “curiosity”, “fear” and “anger”, as well as “attention” and “passivity”, binary information regarding occurrence on a moment-by-moment basis was analysed. For “attention” and “passivity”, which were perceived as time periods, the durations of these episodes were analysed. The merged data matrix led to a hierarchically multilevel data set with subject as level 1 and measurement time as level 2. According to Singer & Willett (2003), this is adequate for this type of multilevel data structure, contrast effects were estimated by running mixed models. In the case of ratio-scaled dependent variables (duration of episodes), linear regression mixed models were applied; in the case of binary occurrence of emotional responses, logistic regression mixed models were utilized. The dependent variable was the occurrence of an emotional response (yes/no) and the predictive variable was the respective stimulus.
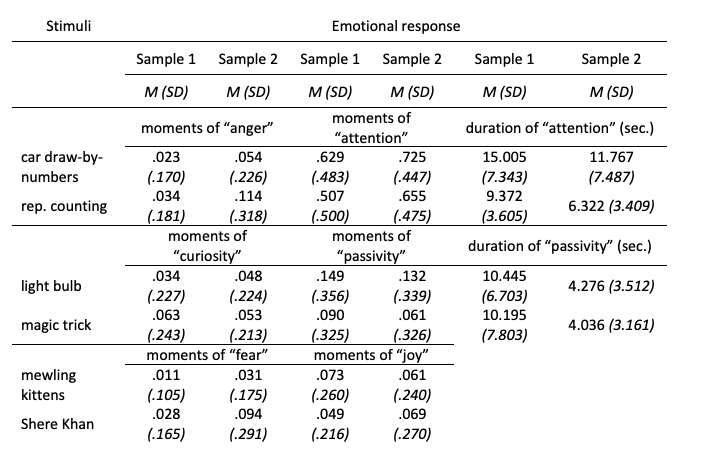
Table 3 provides an overview of the occurrence rates of emotional responses during the selected stimuli that show that the occurrence of emotional responses is rather low with a large standard deviation. Focusing on the coupling of the emotional responses suggested by the manufacturer of the BM sensor wristband, the descriptive data supports the examination of the contrasts between "curiosity" and "passivity", "attention" and "anger" as well as "joy" and "fear", as we found that the frequency and duration of each emotional response seems higher during the induced stimulus than during the reference stimulus.
Table 3
Means (M) and standard deviations (SD) for the overall occurrence (moments) and durations of contrasted Emotional Responses during the selected stimuli
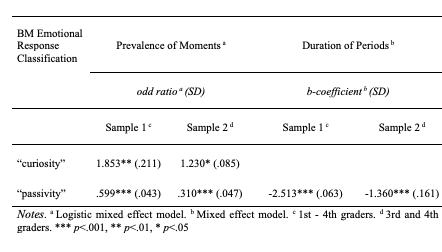
The first analysed stimuli were magic trick and light bulb (see Table 4). We calculated the occurrence of emotional responses such as “curiosity” and “passivity” during the stimulus magic trick compared to the stimulus light bulb. The results showed for both samples, that the prevalence of moments for "curiosity" was higher and "passivity" was lower during the magic trick stimulus compared to the light bulb stimulus. The results for the duration of periods of “passivity” showed that “passivity” periods were shorter during the magic trick stimulus than during the light bulb stimulus.
Table 4
“Curiosity” and “passivity” during watching a magic trick video compared to looking at an image of a light bulb
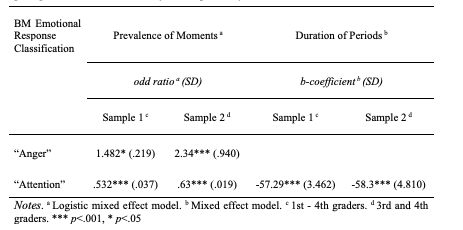
The second analysed stimuli were repeated counting and car draw-by-numbers (see Table 5). We calculated the occurrence of emotional responses, such as “anger” and “attention”, during the stimulus repeated counting compared to the stimulus car draw-by-numbers. The results showed for both samples, that the prevalence of moments for "anger" was higher and "attention" was lower during the repeated counting stimulus compared to the car draw-by-numbers stimulus. The results for the duration of periods of “attention” showed that “attention” periods were shorter during the repeated counting stimulus than during the car draw-by-numbers.
Table 5
“Anger” and “attention” during repeated counting compared with the viewing of numbers getting connected with strokes to form the picture of a car
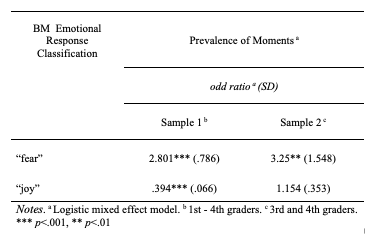
The third analysed stimulus was Shere Khan attacking Mowgli and mewling kittens. We calculated the occurrence of emotional responses, such as “fear” and “joy”, during the stimulus Shere Khan attacking Mowgli compared to the stimulus mewling kittens (see Table 6). The results showed for sample 1 that the prevalence of moments for "fear" was higher and "joy" was lower during the Shere Khan attacking Mowgli stimulus compared to the mewling kittens stimulus. In sample 2, the results pointed in the same direction, however, the contrast was not significant. “Fear” and “joy" were not perceived as episodes; therefore, their duration was not analysed.
Table 6
Fear” and “joy” during watching the scene of Shere Khan attacking Mowgli compared to looking at mewling kittens
Overall, our results indicate that emotional responses can be analysed validly based on physiological data such as skin conductivity and skin temperature in primary school children. Thus, they confirm and expand the findings of Bergner et al. (2013) and Li et al. (2016), who examined this measurement method on adults. Hence, the measurement of physiological data could contribute to a more accurate recording of emotions in young children, which has been highlighted as an important requirement for understanding emotional and motivational processes during learning (Turner & Trucano, 2014). Young children’s developmental constraints, which have an impact on retrospective recording methods such as self-reports (D’Mello & Graesser, 2007; Turner & Trucano, 2014), could thus be avoided. Therefore, by using the BM system, we hope to have identified a way to go beyond self-reports (Järvenoja et al., 2018).
The results showed that, the respective induced emotional responses occurred primarily during the corresponding stimulus, however, the values of the descriptive statistics are rather low. Considering that these are mean values that also include subjects with a value of 0, i.e. who showed no reaction, the results are plausible. Interpreting the results of the descriptive data, it was noticeable that both the induced and the non-induced emotional responses occur during the stimuli. This could be possible because a) spontaneous or non-specific changes also occur in the absence of an identifiable stimulus (Boucsein, 2012), and b) stimuli enhance specific emotional responses, but these do not always occur exclusively (Kreibig, 2014). Accordingly, although our results indicate that the emotional responses occurred primarily during the corresponding stimulus, we cannot be sure that these emotional responses were exclusively based on the stimuli.
In both samples, according to the contrasting analysis, emotional responses “curiosity”, “attention”, “fear”, “anger” and “passivity” were high or low, respectively. Thus, we assume that our expectations on the emotional induction outcome of different stimuli were met. Accordingly, in the light of the studies by Kreibig (2010) and Immordino-Yang & Christodoulou (2014), we managed to evaluate emotional responses via physiological data. However, although the expected fear-producing stimulus (Shere Khan attacking Mowgli), induced more “fear” and less “joy” response moments than the joy-producing stimulus (mewling kittens), the value for "joy" was not significant in sample 2. The interpretation of the results of the non-significant value for "joy" could possibly be based on the different age composition. It could be possible that older children experienced similar amounts of “joy” during the two stimuli Shere Kan attacking Mowgli and mewling kittens. Possibly, the older children were aware that the film scene was fictional and therefore not really dangerous but also funny. To better investigate the “joy” responses compared to the “fear” responses, a different stimulus should be chosen for older students in future studies.
In sum, capturing physiological data and thus drawing conclusions regarding individual emotional experiences during learning can provide a more accurate understanding of the occurrence of different emotional responses and how these can influence learning. If it were possible in future studies to systematically and comprehensively analyse the dynamic interplay of emotional activities with regard to learning processes more precisely, we will be able to better understand the learning processes of children. This research would be especially beneficial if the learning processes of younger children are to be studied, as they still have limited working memory capacity, and their emotional responses are often difficult to capture through conventional self-reports (D’Mello & Graesser, 2007; Turner & Trucano, 2014). Hence, the analysis of emotional responses during learning using physiological data may help to elucidate why some students learn successfully, while others have difficulties developing the resources to be academically successful (Pintrich, 2003). The capture and analyses of emotional responses can provide initial insights into the frequency with which emotions occur during learning. Our study can be understood as a first step towards measuring and understanding primary school children’s emotional responses using physiological data.
In future studies, the BM system might enable us to investigate the occurrence of emotions and learning processes more closely, as stipulated by Pintrich (2003). If we can capture emotional responses via physiological reactions in primary school-age children, we would be able to associate them with learning outcomes. Achieving a better understanding of the wide variety of emotions and fundamental processes of engagement in learning that arise during children's learning processes, such as joy, curiosity, attention, fear, anger, or passivity, may help us design learning environments that are more suitable for primary school children and help them improve their learning (Rodriguez et al., 2012; Shen et al., 2009). Thus, in a future study, we want to examine emotional responses during learning in more detail. This research may help to determine appropriate teaching methods to support children's learning processes according to their needs.
Capturing physiological data results in large, complex and context-specific data sets. The evaluation of the raw data is a considerable challenge (Järvenoja et al., 2018). The handling of missing or blurred data using traditional statistical techniques, modern data mining and machine learning techniques has not yet been sufficiently examined on this type of data (Azevedo, 2019). In addition, the classification of physiological data as emotional responses, especially in different contexts, is still insufficiently researched and have not been sufficiently empirically validated (Harley, 2015). In order to complement standardized survey methods, it is essential to use measurement devices that reliably capture physiological data and meet research standards (e.g., measurement frequency or filtering of artefacts) (Gravina et al., 2017). Many commercially distributed devices are available, but we trusted the BM Sensor Wristband, as it has already been used and tested on adults in cooperation with the Gesis Leibniz Institute for the Social Sciences (Li et al., 2016; Papastefanou, 2013) generating validated results. However, to achieve full validation of the sensor wristband, it would be necessary to perform the same procedure with other devices available on the market and compare them. Besides, data are interpreted based on the algorithms of the devices (Lohani et al., 2019). In this study, we note that we are not able to present the BM emotional response classification algorithm. This makes the evaluation of the results much more difficult than if it could be presented, which is why we also verified our results via a second sample. In addition, we have tried to be as careful as possible in selecting and evaluating the stimuli. The actual study was based on the measurement of the physiological data of the emotional responses of the students. However, tracking the facial expressions or gestures of the students during the confrontation with the stimuli would certainly have provided further valuable insights into the validity of the measurement. Accordingly, our study is only a first step in validating the BM sensor wristband and further validation would be useful, for example by comparing occurring emotional responses with the observation of students' facial expressions and gestures in authentic learning situations.
The findings of the present study rely on two samples that consist of children from first to fourth grade. For more specific applications, it might be worthwhile to analyse age-related subgroups separately to control differential stimulus effects. However, this approach would require a larger sample. With the second sample, we have attempted to take a first step in this direction. Moreover, these analyses were group-based and findings that hold for groups cannot be generalized to within-person processes (Hamaker, 2012). Therefore, the classification system might not be reliable enough to be used at the level of the individual students and individual emotions.
Finally, the analysis was limited to six emotional responses and performed by comparing the physiological data of two contrasting emotional responses and two contrasting stimuli with each other. In addition, no counterbalance was created to the sequence of stimuli. However, students constantly experience a variety of emotions, not only the selected six emotional responses but also others such as hope, pride or shame which cannot be captured with the instrument. If such devices are to be used in authentic learning situations, it will be even more difficult to identify the stimuli that trigger emotional responses in the context of learning, as emotional responses can be based on any causal contexts, such as teacher, task, social context, personal thoughts, peer behaviour and physical needs which cannot be separated (Lewis, 2000). Moreover, the setup of the current study required a rather passive movement behaviour of the children. In authentic learning environments, children might move more, which could have an impact on skin conductance and thus emotional response data (Endedijk et al., 2018). Although the BM Technology compensates movement artefacts by using simultaneously measured data on electrode contact quality and acceleration (Nuñez et al., 2018; Resch et al., 2015; Zeile et al., 2015), further studies should consider this limitation. Accordingly, we cannot assume with certainty that the instrument would function in an authentic learning situation which allows for more movement and where the stimuli are not controlled. Thus, the combination with other forms of data collection (e.g. video recordings or questionnaires) seems to be crucial and offers the possibility to expand and further refine the use of emotion measurement procedures in educational research. (Harley, 2015).
Despite these limitations, the results of this study indicate that the BM system is capable of validly measuring emotional responses via physiological data in primary school children. It can capture multiple data sets per second without the selfreport bias, allowing rapid and dynamic transitions of emotional responses to be tracked (Harley, 2019). The BM system as a physiological measuring device offers a promising method in the context of learning research in capturing emotion responses at a granular level (Harley, 2015). In the future, it might be possible to capture physiological responses and their trajectories during teaching and learning processes and thus explore the reciprocal influence of emotional responses and learning processes.
The authors thank Georgios Papastefanou for his consultation on this project and Philip Koch for his assistance in data collection. We would also like to thank all schools, teachers, parents and students who participated in the research.
Azevedo, R., & Gašević, D. (2019).
Analyzing multimodal multichannel data about self-regulated
learning with advanced learning technologies: Issues and
challenges. Computers in Human Behavior, 96,
207-210.
Barrett, L. F. (2006). Solving the Emotion Paradox: Categorization
and the Experience of Emotion. Personality and Social
Psychology Review, 10(1), 20–46.
https://doi.org/10.1207/s15327957pspr1001_2
Bergner, B. S., Exner, J. P., Memmel, M., Raslan, R., Talal, M.,
Taha, D., & Zeile, P. (2013). Human sensory assessment methods
in urban planning–a case study in alexandria. In PLANNING
TIMES–You better Keep Planning or You get in Deep Water, for the
Cities they are A-Changin'. Proceedings of 18th International
Conference on Urban Planning, Regional Development and
Information Society (pp. 407–417). CORP–Compentence
Center of Urban and Regional Planning.
Boucsein, W. (2012). Electrodermal activity. Springer
Science & Business Media.
Brandstätter, V., Schüler, J., Puca, R. M. & Lozo, L. (2018).
Motivation und Emotion: Allgemeine Psychologie für Bachelor
(springer-Lehrbuch) (2nd ed.). Springer.
Brünken, R., & Seufert, T. (2006). Aufmerksamkeit, Lernen,
Lernstrategien. In H. Mandl & H. F. Friedrich (Eds.), Handbuch
Lernstrategien (pp. 27–37). Hogrefe.
D'Mello, S., & Graesser, A. (2007). Monitoring affective
trajectories during complex learning.Proceedings of the Annual
Meeting of the Cognitive Science Society 29(29),
203–208. https://escholarship.org/uc/item/6p18v65q????
Ekman, P., & Cordaro, D. (2011). What is meant by calling
emotions basic. Emotion review, 3(4), 364–370.
Ekman, P. (1999) Basic emotions. In: T, Dalgleish & M, Power
(Eds.) Handbook of Cognition and Emotion (pp.45–60).
Wiley.
Ekman, P. (1982). Methods for measuring facial action. In K. R.
Scherer & P. Ekman (Eds.), Handbook of Methods in
Nonverbal Behavior Research (pp. 45– 90).
Cambridge University Press.
Endedijk, M., Hoogeboom, M., Groenier, M., de Laat, S. & van
Sas, J. (2018). Using sensor technology to capture the structure
and content of team interactions in medical emergency teams during
stressful moments. frontline Learning Research, 123–147.
https://doi.org/10.14786/flr.v6i3.353
Engel, S. (2011). Children’s Need to Know: Curiosity in Schools. Harvard
Educational Review, 81(4), 625–645.
https://doi.org/10.17763/haer.81.4.h054131316473115
Eren, A. & Coskun, H. (2016). Students’ level of boredom,
boredom coping strategies, epistemic curiosity, and graded
performance. The Journal of Educational Research, 109(6),
574–588. https://doi.org/10.1080/00220671.2014.999364
Eysenck, M., Payne, S. & Derakshan, N. (2005). Trait anxiety,
visuospatial processing, and working memory. Cognition &
Emotion, 19(8), 1214–1228.
https://doi.org/10.1080/02699930500260245
Falk, B. (1998). Effects of Thermal Stress During Rest and
Exercise in the Paediatric Population. Sports Med. 25,
221–240. https://doi.org/10.2165/00007256-199825040-00002
Götz, T., Frenzel, A. C., & Pekrun, R. (2007). Emotionen im
Lern- und Leistungskontext. Katechistische Blätter, 132(1),
13–19.
Götz, T., Pekrun, R., Zirngibl, A., Jullien, S., Kleine, M., vom
Hofe, R. & Blum, W. (2004). Leistung und emotionales Erleben
im Fach Mathematik. Zeitschrift für Pädagogische Psychologie,
18(3/4), 201–212.
https://doi.org/10.1024/1010-0652.18.34.201
Gravina, R., Alinia, P., Ghasemzadeh, H., & Fortino, G.
(2017). Multi-sensor fusion in body sensor networks:
State-of-the-art and research challenges. Information Fusion,
35, 68-80. https://doi.org/10.1016/j.inffus.2016.09.005
Hamaker, E. L. (2012). Why researchers should think
“within-person”: A paradigmatic rationale. In M. R. Mehl & T.
S. Conner (Eds.), Handbook of Research Methods for Studying
Daily Life (pp. 43-61). Guilford.
Harley, J. M., Jarrell, A., & Lajoie, S. P. (2019). Emotion
regulation tendencies, achievement emotions, and physiological
arousal in a medical diagnostic reasoning simulation. Instructional
Science, 47(2), 151–180.
https://doi.org/10.1007/s11251-018-09480-z
Harley, J. M. (2015). Measuring Emotions: A Survey of Cutting Edge
Methodologies Used in Computer-Based Learning Environment
Research. In S. Tettegah & M. Gartmeier (Eds.), Emotions,
Technology, Design, and Learning (pp. 89–114). Academic
Press, Elsevier.
https://doi.org/10.1016/B978-0-12-801856-9.00005-0
Hascher, T., & Brandenberger, C.C. (2018). Emotionen
und Lernen im Unterricht. In M. Huber & S.
Krause (Eds.), Bildung und Emotionen (pp. 289–310).
Springer.
Hayes, D. J., Duncan, N. W., Xu, J. & Northoff, G. (2014). A
comparison of neural responses to appetitive and aversive stimuli
in humans and other mammals. Neuroscience & Biobehavioral
Reviews, 45, 350–368.
https://doi.org/10.1016/j.neubiorev.2014.06.018
Horwitz, A. V. (2013). Anxiety: A short history. JHU
Press.
Immordino-Yang, M. H., & Christodoulou, J. A. (2014).
Neuroscientific contributions to understanding and measuring
emotions in educational contexts. In R. Pekrun, & L.
Linnenbrink-Garcia (Eds.), Educational psychology handbook
series. International handbook of emotions in education
(pp. 607–624). Taylor & Francis / Routledge.
Jamet, E., Gavota, M. & Quaireau, C. (2008). Attention guiding
in multimedia learning. Learning and Instruction, 18(2),
135–145. https://doi.org/10.1016/j.learninstruc.2007.01.011
Jänig, W. (2008). Integrative action of the autonomic
nervous system: Neurobiology of homeostasis . Cambridge
University Press.
Järvenoja, H., Järvelä, S., Törmänen, T., Näykki, P., Malmberg,
J., Kurki, K., Mykkänen, A. & Isohätälä, J. (2018). Capturing
motivation and emotion regulation during a learning process. frontline
Learning Research, 85–104.
https://doi.org/10.14786/flr.v6i3.369
Kołodziej, M., Tarnowski, P., Majkowski, A., & Rak, R. J.
(2019). Electrodermal activity measurements for detection of
emotional arousal. Bulletin of the Polish Academy of Sciences: Technical
Sciences, 813–826.
https://doi.org/10.24425/bpasts.2019.130190
Krapp, A. & Prenzel, M. (2011). Research on Interest in
Science: Theories, methods, and findings. International Journal of
Science Education, 33(1), 27–50.
https://doi.org/10.1080/09500693.2010.518645
Kreibig, S. D. (2010). Autonomic nervous system activity in
emotion: A review. Biological Psychology, 84(3),
394–421. https://doi.org/10.1016/j.biopsycho.2010.03.010
Kreibig, S. D. (2014). Autonomic Nervous System Measurement of
Emotion in Education and Achievement Settings. In R. Pekrun, &
L. Linnenbrink-Garia (Eds.), Educational psychology handbook
series. International handbook of emotions in education
(pp. 625–642). Taylor & Francis / Routledge.
Lee, S. & Lang, A. (2009). Discrete Emotion and Motivation:
Relative Activation in the Appetitive and Aversive Motivational
Systems as a Function of Anger, Sadness, Fear, and Joy During
Televised Information Campaigns. Media Psychology, 12(2),
148–170. https://doi.org/10.1080/15213260902849927
Levenson, R. W. (2014). The Autonomic Nervous System and Emotion.
Emotion Review, 6(2), 100–112.
https://doi.org/10.1177/1754073913512003
Levenson, R. W. (2011). Basic Emotion Questions. Emotion
Review, 3 (4), 379–386.
https://doi.org/10.1177/1754073911410743
Levenson, R. W. (2006). Blood, Sweat, and Fears. Annals of
the New York Academy of Sciences, 1000(1),
348–366. https://doi.org/10.1196/annals.1280.016
Levenson, R. W. (2003). Autonomic specificity and emotion.
In R. J. Davidson, K. R. Scherer, & H. H. Goldsmith (Eds.), Series
in affective science. Handbook of affective sciences (p.
212–224). Oxford University Press.
Lewalter, D., & Schreyer, I. (2000). Entwicklung von
Interessen und Abneigungen-zwei Seiten einer Medaille?: Studie zur
Entwicklung berufsbezogener Abneigungen in der Erstausbildung. In
U. Schiefele, & K.P. Wild (Eds.), Interesse und
Lernmotivation, Untersuchungen zu Entwicklung, Förderung und
Wirkung (pp. 53–72). Waxmann.
Lewis, M. (2000). The emergence of human emotions. In M. Lewis
& J. M. Haviland‐Jones (Eds.), Handbook of emotions
( 2nd ed., pp. 304– 319). Guilford Press.
Li, X., Hijazi, I., Koenig, R., Lv, Z., Zhong, C. & Schmitt,
G. (2016). Assessing Essential Qualities of Urban Space with
Emotional and Visual Data Based on GIS Technique. ISPRS
International Journal of Geo-Information, 5(11), 218.
https://doi.org/10.3390/ijgi5110218
Linnenbrink-Garcia, L., Patall, E. A. & Pekrun, R. (2016).
Adaptive Motivation and Emotion in Education. Policy Insights
from the Behavioral and Brain Sciences, 3(2), 228–236.
https://doi.org/10.1177/2372732216644450
Lohani, M., Payne, B. R., & Strayer, D. L. (2019). A review of
psychophysiological measures to assess cognitive states in
real-world driving. Frontiers in human neuroscience, 13,
57. https://doi.org/10.3389/fnhum.2019.00057
Lohrmann, K., Haag, L., & Götz, T. (2011). Dösen bis zum
Pausengong: Langeweile im Unterricht; Ursachen und
Regulationsstrategien von Schülerinnen und Schülern.Schulverwaltung:
Zeitschrift Für Schulleitung Und Schulaufsicht, 34(4),
113–116. http://nbn-resolving.de/urn:nbn:de:bsz:352-183935
Lohrmann, K. (2008). Langeweile im Unterricht. Ergänzende
Darstellung des Forschungsstands: Zusammenfassung von
Einzelstudien . Waxmann.
http://www.waxmann.com/kat/1896.html
Lombrozo, T. (2016). Explanatory Preferences Shape Learning and
Inference. Trends in Cognitive Sciences, 20(10),
748–759. https://doi.org/10.1016/j.tics.2016.08.001
Markey, A., & Loewenstein, G. (2014). Curiosity. In R. Pekrun,
& L. Linnenbrink-Garia (Eds.), Educational psychology
handbook series. International handbook of emotions in education
(pp. 228–245). Taylor & Francis / Routledge.
Martinent, G., Campo, M., & Ferrand, C. (2012). A descriptive
study of emotional process during competition: Nature, frequency,
direction, duration and co-occurrence of discrete emotions. Psychology
of Sport and Exercise, 13(2), 142–151.
https://doi.org/10.1016/j.psychsport.2011.10.006
Mees, U. (2020). Ärger. In M. A. Wirtz (Ed.), Dorsch –
Lexikon der Psychologie. Hogrefe.
Moosbrugger, H. & Kelava, A. (2012). Testtheorie und
Fragebogenkonstruktion (Springer-Lehrbuch ) (2nd
ed.). Springer.
Mulryan, C. M. (1992). Student Passivity During Cooperative Small
Groups in Mathematics. The Journal of Educational Research,
85(5), 261–273.
https://doi.org/10.1080/00220671.1992.9941126
Nakasone, A., Prendinger, H., & Ishizuka, M. (2005). Emotion
recognition from electromyography and skin conductance.
Proc. of the 5th International Workshop on Biosignal
Interpretation , 219–222.
Nuñez, J., Teixeira, I., Silva, A., Zeile, P., Dekoninck, L. &
Botteldooren, D. (2018). The Influence of Noise, Vibration, Cycle
Paths, and Period of Day on Stress Experienced by Cyclists. Sustainability,
10(7), 2379. https://doi.org/10.3390/su1007237
Oxendine, J. B. (1970). Emotional Arousal and Motor Performance. Quest,
13(1), 23–32.
https://doi.org/10.1080/00336297.1970.10519673
Panksepp, J. & Watt, D. (2011). What is Basic about Basic
Emotions? Lasting Lessons from Affective Neuroscience. Emotion
Review, 3(4), 387–396.
https://doi.org/10.1177/1754073911410741
Panksepp, J. (1982). Toward a general psychobiological theory of
emotions. Behavioral and Brain Sciences, 5(3), 407–422.
https://doi.org/10.1017/s0140525x00012759
Papastefanou, G. (2013). Experimentelle Validierung eines
Sensor-Armbandes zur mobilen Messung physiologischer
Stress-Reaktionen. GESIS-Technical Reports, 07,
1–14. https://nbn-resolving.org/urn:nbn:de:0168-ssoar-339493
Paris, S. G., & Turner, J. C. (1994). Situated motivation. In
P. R. Pintrich, D. R. Brown, & C. E. Weinstein (Eds.),
Student Motivation, Cognition, and Learning: Essays in Honor of
Wilbert J. McKeachie (pp. 213–237). Lawrence Erlbaum
Associates.
Pekrun, R. (2018). Emotion, Lernen und Leistung. In M. Huber,
& S. Krause (Eds.), Bildung und Emotion (pp.
215–579). Springer.
Pekrun, R. (2017). Emotion and Achievement During Adolescence. Child
Development Perspectives, 11(3), 215–221.
https://doi.org/10.1111/cdep.12237
Pekrun, R., & Bühner, M. (2014). Self-Report Measures of
Academic Emotions. In R. Pekrun, & L. Linnenbrink-Garia
(Eds.), Educational psychology handbook series.
International handbook of emotions in education (pp.
561–579). Taylor & Francis.
Pekrun, R., & Linnenbrink-Garcia, L. (2012). Academic emotions
and student engagement. In S. L. Christenson, A. L. Reschly &
C. Wylie (Eds.), Handbook of research on student engagement
(pp. 259–282). Springer.
https://doi.org/10.1007/978-1-4614-2018-7_12
Pekrun, R., & Stephens, E. J. (2012). Academic emotions.
In K. R. Harris, S. Graham, T. Urdan, S. Graham, J. M. Royer,
& M. Zeidner (Eds.), APA handbooks in psychology®. APA
educational psychology handbook, Vol. 2. Individual differences
and cultural and contextual factors (pp. 3–31). American
Psychological Association.
Pekrun, R., Goetz, T., Frenzel, A. C., Barchfeld, P. & Perry,
R. P. (2011). Measuring emotions in students’ learning and
performance: The Achievement Emotions Questionnaire (AEQ).
Contemporary Educational Psychology, 36(1), 36–48.
https://doi.org/10.1016/j.cedpsych.2010.10.002
Pekrun, R., Goetz, T., Titz, W. & Perry, R. P. (2002).
Academic Emotions in Students’ Self-Regulated Learning and
Achievement: A Program of Qualitative and Quantitative Research. Educational
Psychologist, 37(2), 91–105.
https://doi.org/10.1207/s15326985ep3702_4
Pintrich, P. R. (2003). A Motivational Science Perspective on the
Role of Student Motivation in Learning and Teaching Contexts .
Journal of Educational Psychology, 95(4), 667–686.
https://doi.org/10.1037/0022-0663.95.4.667
Piórkowska, M., & Wrobel, M. (2017). Basic emotions. In V.
Zeigler-Hill & T. K. Shackelford (Eds.), Encyclopedia of
personality and individual differences (pp. 1–6). Springer.
Posner, M. I., & Rothbart, M. K. (2005). Influencing brain
networks: implications for education. Trends in Cognitive
Sciences, 9(3), 99–103.
https://doi.org/10.1016/j.tics.2005.01.007
Resch, B., Sudmanns, M., Sagl, G., Summa, A., Zeile, P. &
Exner, J.-P. (2015). Crowdsourcing Physiological Conditions and
Subjective Emotions by Coupling Technical and Human Mobile
Sensors. GI_Forum, 1, 514–524.
https://doi.org/10.1553/giscience2015s514
Riley, J. L., McKevitt, B. C., Shriver, M. D. & Allen, K. D.
(2011). Increasing On-Task Behavior Using Teacher Attention
Delivered on a Fixed-Time Schedule. Journal of Behavioral
Education, 20(3), 149–162.
https://doi.org/10.1007/s10864-011-9132-y
Rodriguez, P., Ortigosa, A., & Carro, R. M. (2012). Extracting
emotions from texts in e-learning environments. In 2012
Sixth International Conference on Complex, Intelligent, and
Software Intensive Systems (pp. 887–892).
Rösler, F., Heuer, H., Hasselhorn, M. & Gold, A. (2009).Pädagogische
Psychologie: Erfolgreiches Lernen und Lehren (Kohlhammer
Standards Psychologie) (2nd ed.). Kohlhammer.
Roth, G. (2011). Bildung braucht Persönlichkeit, wie Lernen
gelingt (3 rd ed.). Klett-Cotta.
Russel, W. B. (1980). Review of the Role of Colloidal Forces in
the Rheology of Suspensions. Journal of Rheology, 24(3),
287–317. https://doi.org/10.1122/1.549564
Scherer, K. R. (1999). Appraisal theory. In T. Dalgleish
& M. J. Power (Eds.), Handbook of cognition and emotion
(pp. 637–663). John Wiley & Sons Ltd.
Shen, L., Wang, M., & Shen, R. (2009). Affective e-learning:
Using “emotional” data to improve learning in pervasive learning
environment. Journal of Educational Technology & Society,
12(2), 176–189.
Sidelinger, R. J. & Booth-Butterfield, M. (2010).
Co-constructing Student Involvement: An Examination of Teacher
Confirmation and Student-to-Student Connectedness in the College
Classroom. Communication Education, 59(2), 165–184.
https://doi.org/10.1080/03634520903390867
Singer, J. D., & Willett, J. B. (2003). Applied
longitudinal data analysis: Modeling change and event
occurrence. Oxford University Press.
https://doi.org/10.1093/acprof:oso/9780195152968.001.0001
Siyez, D. ğ. M. (2017). School-related variables in the dimensions
of anger in high school students in Turkey . International
Journal of School & Educational Psychology, 6 (2),
112–123. https://doi.org/10.1080/21683603.2017.1302849
Steinmayr, R., Ziegler, M. & Träuble, B. (2010). Do
intelligence and sustained attention interact in predicting
academic achievement? Learning and Individual Differences, 20(1),
14–18. https://doi.org/10.1016/j.lindif.2009.10.009
Sturm, W. (2005). Aufmerksamkeitsstörungen. Hogrefe.
Turner, J., & Trucano, M. (2014). Measuring situated emotion.
In R. Pekrun & L. Linnenbrink-Garia (Eds.), Educational
psychology handbook series. International handbook of emotions
in education (pp. 643–658). Taylor & Francis /
Routledge.
Winne, P. H., & Perry, N. E. (2000). Measuring self-regulated
learning. In M. Boekaerts, P.R. Pintrich, & M. Zeidner (Eds.),
Handbook of self-regulation (pp. 531–566). Academic
Press.
Zeile, P., Resch, B., Dörrzapf, L., Exner, J. P., Sagl, G., Summa,
A., & Sudmanns, M. (2015). Urban Emotions–tools of integrating
people’s perception into urban planning. In REAL CORP 2015.
PLAN TOGETHER–RIGHT NOW–OVERALL. From vision to reality for
vibrant cities and regions. Proceedings of 20th international
conference on urban planning, regional development and
information society (pp. 905–912). CORP–Competence Center
of Urban and Regional Planning.
Zillmann, D. (2008). Emotional Arousal Theory. The
International Encyclopedia of Communication.
https://doi.org/10.1002/9781405186407.wbiece022