![]()
Frontline Learning Research Vol.8 No. 6 (2020) 77
- 87
ISSN 2295-3159
1PSI Services, LLC, USA
2Carnegie Mellon, USA
3Teachers College Columbia University, USA
4University of Wisconsin—Madison, USA
5University of Illinois at Chicago, USA
Article received 30 December 2019 / revised 10 May/ accepted 12 October/ available online 4 November
A driving factor in designing interactive museum exhibits to support simultaneous users is that visitors learn from one another via observation and conversation. Researchers typically analyze such collaborative interactions among museumgoers through manual coding of live- or video-recorded exhibit use. We sought to determine how log data from an interactive multi-user exhibit could indicate patterns in visitor interactions that could shed light on informal collaborative learning. We characterized patterns from log data generated by an interactive tangible tabletop exhibit using factors like “pace of activity” and the timing of “success events.” Here we describe processes for parsing and visualizing log data and explore what these processes revealed about individual and group interactions with interactive museum exhibits. Using clustering techniques to categorize museumgoer behavior and heat maps to visualize patterns in the log data, we found distinct trends in how users solved the exhibit. Some players seemed more reflective, while others seemed more achievement oriented. We also found that the most productive sessions occurred when players occupied all four areas of the table, suggesting that the activity design had the desired outcome of promoting collaborative activity.
Keywords: collaborative interactions; game-based learning; heat maps; cluster analysis; log files; informal learning environments
While the design community harbors enthusiasm for log data analysis, many open questions exist about what this decontextualized data can tell us about collaborative interactions in open-ended tinkering activities. Multi-user touch-tables are gaining popularity in informal spaces like museums for their ability to allow groups of users to interact with the exhibit in a social setting simultaneously (Block et al., 2015; Davis et al., 2013). Such exhibit usage affords interactions conducive to learning, such as observing and exploratory tinkering (Roberts & Lyons, 2017; Yoon et al., 2012). These productive behaviors are observable in live interactions, but observations that span multiple weeks produce too much data to analyze manually (Snibbe, 2006). We hypothesize that log data from such a tabletop interactive exhibit could help identify usage patterns that reveal insights into the collaborative interactions.
To that aim, we analyzed logfile data from a collaborative tabletop exhibit, Oztoc (Tissenbaum et al., 2017, Figure 1), through hierarchical cluster analysis (HCA) and heatmap visualizations. The game’s objective is to catch fish by creating circuits with different colors and numbers of LEDs. The game space has four separate play stations by design to facilitate collaborative inquiry. The players can create circuits on their own or with the help of others.
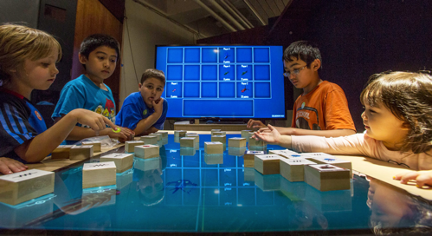
Figure 1. The Oztoc Exhibit. The scoreboard is in the
background.
In this study, we define collaboration as the process by which two or more agents share pooled understanding to work on a problem. Problems that are complex or ill-defined are well-suited to collaborative problem solving and can lead to individual learning. We conceptualize learning through a constructivist lens as actively building on prior knowledge through experimentation and reflection.
Interactive exhibits allow players to make inferences about a game’s underlying principles to refine their game tactics. Much research examining collaborative interaction in museums focuses on visitor dialogue, analyzing how learners construct and negotiate meaning through talk as they explore an exhibit (e.g., Martin et al., 2018; Tissenbaum et al., 2017). Analyses frequently contextualize this dialogue in relation to visitors’ physical interactions with each other and the exhibit (Long et al., 2019; Roberts et al., 2018). These studies rely on data- and time-intensive video recordings, limiting the scope of most studies to small sample populations. The increase of technology-based exhibits in museums in recent years can enable an up-close analysis of exhibit interactions via touch events captured in log files. While some work has shown promise in revealing interaction through touch events alone (Evans et al., 2016), researchers have not established practical methods for measuring collaborative interactions through such files.
This study used cluster analysis heatmaps to group patterns of interactions and visualize log data. Cluster analysis is a descriptive data mining technique in which vectors of data for individuals within a dataset are patterned based on similarity (Alfredo et al., 2010; Bowers, 2010; Romesburg, 1984). In this study, we used Hierarchical Cluster Analysis (HCA), which researchers have shown work well with education data (Bowers, 2010; Lee et al., 2016). Here for the HCA, we used k-means clustering with average linkage as the agglomeration method, which builds up a hierarchical “tree” of log entries by recursively merging those entries that have higher-than-average pairwise similarities. The resulting branches indicate the dominant clusters of patterns present in the logs.
Additionally, we visualized the data with HCA heatmaps (Bowers, 2010; Lee et al., 2016). Cluster analysis heatmaps are a well-established means to visualize high-dimensionality patterns in data while retaining and displaying individual data points in their context and examining fine-grained patterns in the data and identifying overall informative clusters (Wilkinson & Friendly, 2009). Cluster analysis is incredibly helpful for exploring under-studied phenomena, like student programming styles (Berland et al., 2013), expert and novice practices in maker activities (Blikstein, 2013), and how students use exploratory learning environments (Amershi & Conati, 2009). Researchers have also used heatmaps to highlight patterns in teamwork and participation (Upton & Kay, 2009).
Using the ADAGE system (Lyons, 2014), the Oztoc table tracks the movement, addition, and removal of blocks (or circuit “components”) from the table. It also records actions performed with the blocks while on the table (e.g., connections between components). The program logs each event with a timestamp and X-Y coordinates for four types of circuit component blocks (resistors, batteries, LEDs, and timers). We computed the seconds from the timestamps since the last event to determine the movement rate of pieces, which we use as a proxy for the players’ level of activity. Play stations, playerIDs, and sessionIDs were assigned as described next.
Understanding user behavior through logfiles requires first determining how to demarcate unique users in both space and time (Block et al., 2015; Tissenbaum et al., 2016). Oztoc does not constrain users to delimited stations around the table, but the visual design divides the table into four labeled play stations associated with player feedback displayed on a large scoreboard screen. Informal observations indicated that users tended to respond to these design cues and occupy one “play station,” limiting block manipulation and circuit-construction activities to the labeled space. We confirmed this by charting the point coordinates from all the events to the table (Figure 2).
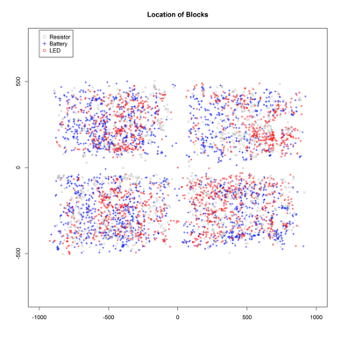
Figure 2. Block placements during play, color-coded by
component type, fall into four quadrants on the touch-table.
This map confirms that players rarely worked in the middle of the table, which parallels findings from similar studies of shared tabletop use (Martínez Maldonado et al., 2010). This was important for us to confirm because the features we cluster require that the block manipulations and circuit completion events can be attributed to a specific user.
We also had to identify how to demarcate players by time since Oztoc runs continually and does not have a dedicated start and stop event. To determine when visitors likely entered or exited the exhibit, the designers analyzed board actions on a single day using a script with inactivity intervals ranging from 10 seconds to 120 seconds. They found that the inactivity metric did not change significantly, ranging from 45 to 120 seconds. To validate the 45-second cutoff time, they hand-labeled a 2-hour sample of video data and found that it was 100% accurate (Tissenbaum et al., 2016). Therefore, lags over 45 seconds for all four player spaces on the table triggered the creation of a new group of users.
The data analyzed here are from an open-ended engineering exhibit situated at the New York Hall of Science (Lyons et al., 2015). In the exhibit, visitors design and build glowing fishing lures to attract simulated bioluminescent fish (Figure 3). To catch all the different fish, players must experiment with creating circuits with different colors and numbers of LEDs. Wooden blocks represent resistors (1), batteries (2), timers (3), and different colored LEDs (4). Participants make circuit connections by bringing the blocks’ positive and negative terminals in contact with one another. Creating a successful circuit causes the LEDs to glow and lures the fish attracted to that light out for cataloging.
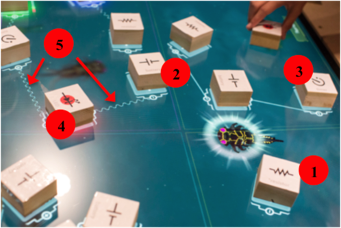
Figure 3. Depiction of the Oztoc exhibit.
This study tests the validity and utility of cluster heatmapping for revealing group interaction patterns by analyzing records from a single afternoon of exhibit usage. In the 133 minutes of recorded interactions during that period, 6,077 unique events were logged as described above.
With players and play stations defined, we restructured the dataset into 10-second intervals of “playtime.” Figure 4 displays players as rows and each of the fifty 10-second timeslices as columns, with a brighter red indicating 20 or more actions within those 10 seconds, and white indicates no data. “Actions” are defined as any logged event in that player’s playstation during that 10 seconds. The clusters were formed by cross comparing the activity levels in these player “trajectories” to investigate whether players engage with the table with the same patterns of intensity over time.
The annotations to the heatmap’s right are labels and were not used to group the player trajectories. “#Circuits” represent the total number of circuits created by that player, with the brighter red indicating more circuits created. “#Circuits Per Sec” shows the total number of circuits created per second. The last four annotation columns on the far right indicate how many other simultaneous players were present with that player.
Figure 4 shows that when individual player trajectories are clustered by similarity, there are at least three different patterns with different “outcomes” (measured by circuits created). The longest and most active clusters only occur when there are four players. The players depicted in Cluster 3 (Figure 4, bottom) use Oztoc for 10 seconds to one minute. These players usually play with few other simultaneous players and make few (if any) circuits. Cluster 1 (Figure 4, top) players have longer play sessions in which there is a consistent level of activity, and players make many circuits. Cluster 2 (Figure 4, middle) players make the most circuits and have the highest activity per 10-second intervals. These players are typified by somewhat shorter play sessions than Cluster 1 and end with rapid tile movement.
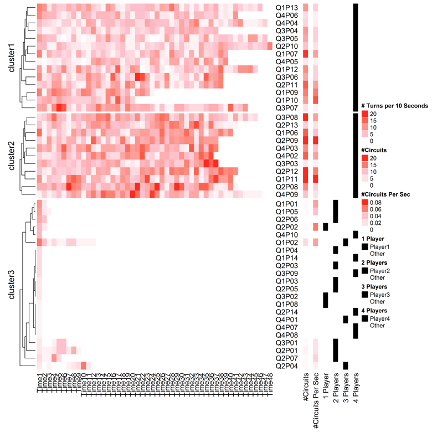
Figure 4. A heatmap revealing clusters based on raw counts
of actions over time.
We then standardized the activity counts using the grand mean across the dataset to reveal differences in activity better. Whereas Figure 4 uses raw numbers, Figure 5 uses z-scores of the number of movements. Each row displays a player, and each of the fifty 10-second timeslices as columns, with annotations to the right. Brighter blue indicates movement increasingly below the mean, with the darkest blue indicating no movement. Darker red indicates a higher average movement of tiles above the mean. In addition, this heatmap was annotated with yellow dots to indicate when the player completed a circuit (although we did not use this information to cluster the player trajectories). These dots reveal the extent to which players are planning before completing a circuit. There seems to be a relationship between the number of moves and completed circuits, and particularly whether players tend to complete more circuits after periods of high or low frequencies of movements.
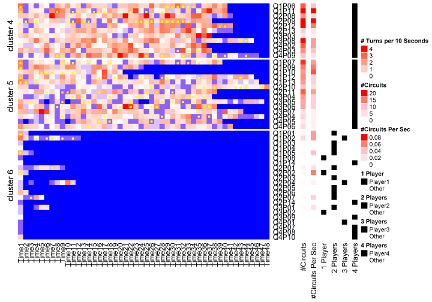
Figure 5. A heatmap revealing clusters of player
trajectories based on z-standardized levels of activity over time.
Figure 5 shows that at least three different types of players (though standardizing the scores cause some individual players to shift between clusters in the two different analyses, so Cluster 1 and Cluster 4 do not comprise the same players). While Clusters 4 and 5 show players who had three companions, and Cluster 6 represents the cluster of players typically in small groups who only interact minimally with Oztoc, Cluster 5 players alternate between blue and red, indicating that they pause often. These players stay at the table longer than Cluster 4 and make fewer circuits overall. Moreover, many of the yellow dots (completed circuits) are in or followed by blue intervals, indicating a pause likely due to the player watching the visual effect triggered by a completed circuit. Cluster 4 has the most red with the lowest blue, indicating continual active interaction with the tiles (indicating more “achievement-oriented” behavior). These players also have rising tile movement across their session, often peaking with yellow dot “streaks” of circuit completion. This group completes more circuits than Cluster 5, in which there are fewer and more randomly distributed yellow dots.
We expected to find variations in duration and circuit creation rates among users of this exhibit and larger groups to have richer interactions. However, the apparent clustering of these interaction patterns and their strong relationship to the number of concurrent players at the table were surprising. According to this data, the more players involved in the game, the more time they spend tinkering, and the more circuits they create, suggesting the game fosters collaborative behavior. However, the data did not necessarily show that the game fostered constructivist learning, as some players seemed to be more reflective (Cluster 5), while others seemed to be achievement-oriented (Cluster 4). A closer investigation of which players belonged to the same play sessions revealed that Cluster 4 and Cluster 5 players are present in sessions together, but the Cluster 6 players are mostly in sessions with other Cluster 6 players. Four of the six Cluster 6 players in groups of four belonged to the same session, suggesting as a group, they may not have understood the game or that their interaction ended prematurely. The other two were members of 5-person sessions, suggesting that the player may have begun at the end of the group’s session and left with the group shortly after starting.
Given that we inferred player actions from log file data in this study and did not validate each action for the entirety of the data, some of the inferences may be inaccurate. For example, a new player could have made a move within the 45-second cutoff interval, and then two players would have erroneously been labeled as one player. It is also possible that one player could move to the play station of another user. However, given that we validated some of these inferences by hand-coding a sample of video data with a high degree of accuracy, we assume that these instances are few and make a negligible impact on the overall inferences we make in this study.
Moreover, we do not want to overstate claims about the degree to which the activity traces provide evidence for players demonstrating constructivist learning interactions. We would need supplementary video or interview data to corroborate that the most productive sessions were ones in which there was constructive dialogue indicating that the players were developing more accurate conceptual models of circuit building.
Making sense of collaborative learning in unstructured activities is a complicated task. However, the difficulty of this problem should not overshadow the importance of deriving methodologies to find evidence that a system is working as intended. This study demonstrates how we derived data for collaborative learning in an interactive museum exhibit using unstructured data. First, we defined what data would constitute evidence for learning. Our metric was not just a simple measure of “success” (i.e., total circuits created) but of “productive behavior” (the relationship of the player moves to the game outcomes). To do so, we investigated player behavior over time to evaluate the extent to which the game fostered “productive” sessions. We assume that when participants make fewer moves to create a unique working circuit, they have a better conceptual understanding of the circuits’ mechanics. Making fewer moves would contrast to “unproductive” behavior in which players either do not realize the game’s goal or consistently use a brute-force approach with no changes in behavior. We found distinct interaction patterns related to the movement rate of the tangible blocks and the number of completed tasks (here, the construction of working circuits).
Second, we accounted for different amounts of time the users interacted with the game and standardized the time blocks, so they were comparable across users. Third, we found patterns in behavior using cluster analysis and heatmaps, which helps to visualize large and complex datasets. The visualizations revealed that the most productive interactions occurred when the table was fully occupied with four simultaneous users, suggesting that collaboration led to more successful goal-oriented actions. This provides evidence that the exhibit fostered collaborative interactions as the designers intended (Lyons et al., 2015). Although this method is not as reliable as a traditional individual assessment, the information derived is richer and can provide more useful information on learning strategies and how systems affect user behavior patterns on a large scale.
This analysis presents several avenues for future investigations. We have hypothesized that the pauses seen with Cluster 5 players represent planning or strategizing before completing a circuit. Further investigation can determine how players’ completion events and pauses relate to companions’ activities. For example, the visualization could be reorganized to display players together by a session with each player offset according to their start times to indicate productive group collaboration. This could indicate whether a user’s completion of a circuit prompts echoing of the same circuit by others.
Furthermore, these visualizations help flag events for finer-grained qualitative analysis to understand the interactions happening “above the table” among participants (Tissenbaum et al., 2017). If further work shows that players in a cluster demonstrate similar challenges, this could help us provide real-time participant support. Such information could alert museum facilitators when to intervene when visitors are frustrated, consequently increasing visitor dwell time and overall domain learning. This method of using log data to identify user strategies and states to provide just-in-time scaffolding can be a useful method for facilitators looking to improve user engagement in other less-structured museum spaces and online learning environments.
This research was made possible by the National Science Foundation data consortium fellowship and the New York Hall of Science.
Alfredo, V., Félix, C., & Àngela, N. (2010). Clustering
Educational Data. In C. Romero, S. Ventura, M. Pechenizkiy &
R. S. J. d. Baker (Eds.), Handbook of Educational Data Mining
(pp. 75-92). Boca Raton, FL: CRC Press.
https://doi.org/10.1201%2Fb10274-8
Amershi, S., & Conati, C. (2009).
Combining unsupervised and supervised classification to build user
models for exploratory learning environments. JEDM| Journal
of Educational Data Mining, 1(1), 18-71.
Berland, M., Martin, T., Benton, T., Petrick Smith, C., &
Davis, D. (2013). Using learning analytics to understand the
learning pathways of novice programmers. Journal of the
Learning Sciences, 22(4), 564-599.
https://doi.org/10.1080%2F10508406.2013.836655
Blikstein, P. (2013, April). Multimodal learning analytics. In
Proceedings of the third international conference on learning
analytics and knowledge (pp. 102-106). ACM.
https://doi.org/10.1145%2F2460296.2460316
Block, F., Hammerman, J., Horn, M.,
Spiegel, A., Christiansen, J., Phillips, B., ... & Shen, C.
(2015, April). Fluid grouping: Quantifying group engagement around
interactive tabletop exhibits in the wild. In Proceedings of
the 33rd Annual ACM Conference on Human Factors in Computing
Systems (pp. 867-876). ACM.
https://doi.org/10.1145%2F2702123.2702231
Bowers, A. J. (2010). Analyzing the
longitudinal K-12 grading histories of entire cohorts of students:
Grades, data-driven decision making, dropping out and hierarchical
cluster analysis. Practical Assessment, Research, and
Evaluation, 15(1), 7.
Davis, P., Horn, M. S., Schrementi, L., Block, F., Phillips, B.,
Evans, E. M., ... & Shen, C. (2013). Going deep: Supporting
collaborative exploration of evolution in natural history museums.
In Proceedings of 10th International Conference on Computer
Supported Collaborative Learning .
Evans, A. C., Wobbrock, J. O., &
Davis, K. (2016, February). Modeling collaboration patterns on an
interactive tabletop in a classroom setting. In Proceedings
of the 19th ACM Conference on Computer-Supported Cooperative
Work & Social Computing (pp. 860-871).
Lee, J. E., Recker, M., Bowers, A., & Yuan, M. (2016, June).
Hierarchical Cluster Analysis Heatmaps and Pattern Analysis: An
Approach for Visualizing Learning Management System Interaction
Data. In EDM (pp. 603-604).
Long, D., McKlin, T., Weisling, A., Martin, W., Guthrie, H., &
Magerko, B. (2019). Trajectories of physical engagement and
expression in a co-creative museum installation. In Proceedings
of the 2019 on Creativity and Cognition (pp. 246-257).
https://doi.org/10.1145%2F3325480.3325505
Lyons, L. (2014). Exhibiting data: Using body-as-interface designs
to engage visitors with data visualizations. In Learning
Technologies and the Body (pp. 197-212). Routledge.
Lyons, L., Tissenbaum, M., Berland, M., Eydt, R., Wielgus, L.,
& Mechtley, A. (2015, June). Designing visible engineering:
supporting tinkering performances in museums. In Proceedings
of the 14th International Conference on Interaction Design and
Children (pp. 49-58).
https://doi.org/10.1145%2F2771839.2771845
Martin, K., Horn, M., & Wilenksy, U. (2018). Ant Adaptation: A
complex interactive multitouch game about ants designed for
museums. In Constructionism Conference.
Martínez Maldonado, R., Kay, J., & Yacef, K. (2010, November).
Collaborative concept mapping at the tabletop. In ACM
International Conference on Interactive Tabletops and Surfaces
(pp. 207-210). ACM. https://doi.org/10.1145%2F1936652.1936690
Roberts, J., Banerjee, A., Hong, A., McGee, S., Horn, M., &
Matcuk, M. (2018, April). Digital exhibit labels in museums:
promoting visitor engagement with cultural artifacts. In
Proceedings of the 2018 CHI Conference on Human Factors in
Computing Systems (pp. 1-12).
https://doi.org/10.1145%2F3173574.3174197
Roberts, J., & Lyons, L. (2017). The value of learning talk:
applying a novel dialogue scoring method to inform interaction
design in an open-ended, embodied museum exhibit.
International Journal of Computer-Supported Collaborative
Learning , 12(4), 343-376.
https://doi.org/10.1007%2Fs11412-017-9262-x
Romesburg, H. C. (1984). Cluster analysis for researchers.
Lifetime Learning Publications.
Snibbe, A. C. (2006). Drowning in data.Stanford Social
Innovation Review, 4(3), 39-45.
Tissenbaum, M., Berland, M., & Lyons, L. (2017). DCLM
framework: understanding collaboration in open-ended tabletop
learning environments. International Journal of
Computer-Supported Collaborative Learning, 12 (1), 35-64.
https://doi.org/10.1007%2Fs11412-017-9249-7
Tissenbaum, M., Kumar, V., & Berland, M. (2016). Modeling
Visitor Behavior in a Game-Based Engineering Museum Exhibit with
Hidden Markov Models. International Educational Data Mining
Society.
Upton,
K., & Kay, J. (2009, June). Narcissus: group and individual
models to support small group work. In International
Conference on User Modeling, Adaptation, and Personalization
(pp. 54-65). Springer, Berlin, Heidelberg.
https://doi.org/10.1007%2F978-3-642-02247-0_8
Wilkinson, L., & Friendly, M.
(2009). The History of the Cluster Heat Map. The American
Statistician, 63(2), 179-184.
https://doi.org/10.1198%2Ftas.2009.0033
Yoon, S. A., Elinich, K., Wang, J., Steinmeier, C., & Tucker,
S. (2012). Using augmented reality and knowledge-building
scaffolds to improve learning in a science museum.
International Journal of Computer-Supported Collaborative
Learning, 7 (4), 519–541.
https://doi.org/10.1007%2Fs11412-012-9156-x