![]()
Frontline Learning Research Vol.8 No. 3 Special
Issue (2020) 104 - 125
ISSN 2295-3159
aDennis Learning Center,
Department of Educational Studies, The Ohio State University, USA
Article received 18 June 2019 / revised 9 October / accepted 30 October / available online 30 March
Despite concerns about their validity, self-report surveys remain the primary data collection method in the research of self-regulated learning (SRL). To address some of these concerns, we took a data set comprised of college students’ self-reported beliefs and behaviours related to SRL, assessed across three surveys, and examined it for instances of a specific threat to validity, insufficient effort responding (IER; Huang, Curran, Keeny, Poposki, & DeShon, 2012). Using four validated indicators of IER, we found the rate of IER to vary between 12-16%. Critically, while we found that students characterised as inattentive and attentive differed in some basic descriptive statistics, the inclusion of inattentive students within the data set did not alter more substantial inferences or conclusions drawn from the data. This study provides the first direct examination of the impact of respondents’ attention on the validity of SRL data generated from self-report surveys.
Keywords: insufficient effort responding; self-regulated learning; self-report; validity
Researchers have used models of self-regulated learning (SRL) to understand engagement, learning, and achievement in academic contexts from preschool through college (Perry et al., 2018; Pintrich & Zusho, 2007; Usher & Schunk, 2018; Winne & Hadwin, 2008). Models of SRL posit that students can plan, monitor, control, and reflect upon their own thoughts, behaviors, and motivation related to their learning (Panadero, 2017). Engagement in SRL requires that students feel both motivated and efficacious to enact these sub-processes (Pajares, 2007; Pintrich & Zusho, 2007). Efforts to use SRL as a basis for developing instructional policies and practices designed to improve students’ academic success is an accepted goal among educators (Cleary & Zimmerman, 2004; Dignath & Buttner, 2008; Schunk & Zimmerman, 1998). Achieving critical goals with regard to these two efforts is in no small part dependent upon the availability of sound methods for assessing SRL (Winnie & Perry, 2000; Wolters & Won, 2018).
The need for sound assessment of SRL has spawned the development of many methods (Azevedo et al.,2018; Winne & Perry, 2000; Zimmerman, 2008). For instance, observing students’ behaviours within the classroom, recording traces of their thinking or behaviour when engaged in academic tasks, and reports by teachers or parents have all been used to assess students’ SRL (Biswas, Baker, & Paquette, 2018; Cleary & Callan, 2018). Despite the promising increase in the diversity of assessments, self-report surveys (SRS) remain the most common method used to assess SRL (Winne & Perry, 2000). We use the term SRS to describe any type of questionnaire or survey in which respondents are presented with a question or statement and asked to provide a response, either retrospectively or concurrently, based on their own beliefs, attitudes, or behaviours. Although they offer many advantages (Butler, 2002; McCardle & Hadwin, 2015; Wolters & Won, 2018), criticisms of SRS, including fundamental questions regarding the validity of the data they produce (Karabenick & Zusho, 2011; Schellings & van Hout-Wolters, 2011; Winne & Jamieson-Noel, 2003).
Developments in the manner under which SRS can be completed, such as the increased use of unsupervised internet-based administrations (e.g. Qualtrics, REDcap, Amazon Mechanical Turk), raises concerns about the evidence for validity from data produced when students complete online SRS for educational research. Responding appropriately to items on an SRS is a function of a complex, multi-step process. To authentically respond to an item, the respondent must read and understand the item, search their memory for relevant information, integrate any activated memories into a coherent answer, match this answer to one of the available response options, and finally decide whether to select that or some other response option (Duckworth & Yeager, 2015). At any point in this process, lack of motivated engagement or inattention on the part of the respondent is a threat to the validity of individual items as well as the overall data produced. Hence, it is important to carefully evaluate potential threats to the validity of the data produced from these SRS (Wolters & Won, 2018). We address this need by evaluating college students’ responses to three online SRS designed to assess factors associated with their SRL, motivation, and academic success for issues related to inattentive responding.
Threats to validity that result from respondents’ lack of cognitive effort, inattention, or motivation when completing surveys have been examined under several different names, including careless responding (Meade & Craig, 2012), insufficient effort responding (IER; Huang et al., 2012), and low-quality data (DeSimone & Harms, 2017). We adopt IER as our preferred term and it is defined as “a response set in which the respondent answers a survey measure with low or little motivation to comply with survey instruction, correctly interpret item content, and provide accurate responses” (Huang et al., 2012, p. 100). In other words, IER occurs when a respondent does not provide the necessary cognitive effort required to go through the multi-step process needed to produce data that appropriately represents the underlying construct. The IER framework and the methods used to identify it encompass physical, cognitive, and motivational disengagement from the survey, all of which threaten its’ validity.
IER may occur for many reasons. For instance, a respondent may be fatigued, distracted by their surroundings, or motivated to complete the SRS as fast as possible and without effort, either because they are forced to take the survey or because they are taking it solely for some promised compensation, like money or extra credit in a course (Johnson, 2005). Mischievous responding, in which a respondent purposefully provides systematically invalid responses (e.g. selecting the same response for all items) can be considered a form of IER because, even though they are providing some effort, it is not directed at interpreting and responding to items appropriately. Socially desirable responding and other unintentional biases that may alter a person’s response patterns do not fall under the IER umbrella because these respondents are working to read, understand, and answer items appropriately.
Researchers have appreciated the threats to validity represented by the underlying causes of IER for some time (Beach, 1989; Nichols et al., 1989). It was not until recently though that researchers began to investigate more vigorously the propensity and importance of IER as a detriment to validity. Two key findings have emerged from this work. One, the exact level of IER within a data set varies from survey to survey and sample to sample, but generally about 10% of respondents are identified as having engaged in some form of IER (Meade & Craig, 2012; Maniaci & Rogge, 2014). Two, while this proportion may not seem noteworthy, the inclusion of even a small percentage of inattentive responders, as low as five percent, can cause spurious relationships among otherwise uncorrelated measures to become significant, mask otherwise significant relationships between variables, lead to inflated mean-level scores on latent constructs, and alter effect size differences between groups (Huang et al., 2017).
This line of research raises serious concerns for those who rely on SRS as a primary means of data collection, SRL researchers included. There are reasons however to question the extent to which this previous research is applicable to SRL, primary among them is that most of this research has derived from assessments of personality and other more stable traits. The more dynamic and changeable nature of motivation and SRL constructs, compared to personality constructs, may result in different manifestations of IER. Additionally, much of the research on IER has utilized samples of undergraduates drawn from participant pools (e.g. Dunn et al., 2016; Huang et al., 2012; Meade & Craig, 2012) that presumably had little intrinsic motivation for completing the SRS. In contrast, our sample consists of students who anticipated using the results of their SRS for meaningful diagnostic purposes as part of a course assignment. Thus, in addition to extending IER research into a new field, we also extend this research into a presumably more motivated sample, which should produce different manifestations of IER.
1.2.1 Methods for Identifying IER
To identify instances of IER, researchers can call upon both proactive and reactive indicators. Proactive methods are based on the inclusion of “check items” throughout an SRS (Huang et al., 2012; Meade & Craig, 2012; Huang et al., 2015; Maniaci & Rogge, 2014; Bowling et al., 2016; Dunn et al., 2016) that provide a way to determine if respondents are reading each item carefully. Some check items direct respondents to a certain answer (e.g. “Mark strongly agree for this item”), while others are statements that no respondent should agree with (e.g. “My birthday is February 30”). Finally, some researchers (e.g. Huang et al., 2012) have simply asked respondents how much effort they put forth when completing items. Although proactive measures have proven useful, the focus of this study was on the use of reactive methods to detect IER.
Reactive methods refer to a variety of post-hoc statistical analyses used to identify IER. With the increased use of technology to administer surveys, using total survey response time, which programs like Qualtrics record automatically, has become an easy and effective means of assessing IER (Huang et al., 2012; Meade & Craig, 2012; Maniaci & Rogge, 2014; Bowling et al., 2016; Dunn et al., 2016). The basic assumption of this approach is that those who spend very little time completing the survey are not fully engaged in the various cognitive processes necessary to respond to items as intended. For instance, respondents may skim items rather than carefully read them or may quickly select a response without deliberate recollection and reasonable consideration of the events that should inform their response. Hence, survey completion times that are extremely short are highly suggestive of IER.
A family of statistical analyses designed to assess the consistency of one’s responses are another set of common reactive methods for identifying IER. As one example, even-odd consistency (Huang et al., 2012; Meade & Craig, 2012; Johnson, 2005) is a measure of individual reliability that is generated by dividing a survey into two parts (traditionally based on odd and even-numbered items) and calculating the correlation between the two parts. The underlying assumption of this method is that alternate items from unidimensional scales should be strongly correlated. Another common individual reliability indicator is referred to as psychometric synonyms/antonyms (Curran, 2016). This indicator is computed by identifying the items with the strongest bivariate correlations within a data set and comparing individual respondents’ correlations on these items. Semantic synonyms/antonyms are used in the same manner, except that the items used in the calculation of this index are decided on an a priori basis, based on item content. For each of these indices, respondents who exhibit unusually weak correlations for the set of relevant pairs of items are thought to have engaged in IER. This conclusion is based on the assumption that the atypical correlations are a function of not reading items carefully enough, answering items randomly, or utilizing another response strategy that falls substantially short of full engagement in the response process, a process which provides increased evidence for the validity of the data (Duckworth & Yeager, 2015; Winne & Perry, 2000).
Another reactive method of assessing IER is founded on statistical analyses designed to assess the variability of an individual’s responses within a survey and includes indices such as long-string analysis (Costa & McCrae, 2008) and individual response variability (IRV; Dunn et al., 2016). The underlying assumption of these indices is that, on surveys with multiple scales assessing individual difference constructs, individuals should be responding with some degree of variability. That is, when individuals respond to a great many items in a row using the same response(s) options (e.g. answering 5 to many items or answering 4,5,4,5,4), especially across scales that do not assess the same trait, they are likely not paying attention to the items or are actively looking to avoid expending cognitive effort. Curran (2016) provides an excellent review of the methods mentioned here, as well as many others that have been used to identify IER.
Because of the overreliance on SRS to assess and understand SRL, it is important that researchers can trust that respondents address items with the care and attention necessary to provide data for valid conclusions. Identifying instances of IER within data sets that contain items assessing the motivational and strategic aspects of SRL is one way that researchers can empirically evaluate their data and in part verify the validity of conclusions they draw regarding SRL. Further, we expand on recent work to identify IER by examining it amongst a group of college students who completed three SRS intended to assess various aspects of motivation and SRL, over the course of one academic semester. A key contribution of the present research lies in our ability examine IER in a single sample of participants, across multiple surveys measuring different constructs. From an SRL perspective, this study provides a direct examination of the possibility that students are not providing the necessary cognitive effort needed when answering items designed to assess their motivation and SRL, which threatens any conclusions using data generated by SRS. We pursued the following research questions:
(1) How prevalent is IER within a sample of college students
completing SRS that assess constructs associated with SRL?
(2) Does IER manifest itself in a consistent way across different
survey administrations within the same sample?
(3) Does students’ engagement in IER alter the results and
conclusions drawn from SRS assessing the motivational and
strategic aspects of SRL?
To answer these questions, we utilized four established reactive indices of IER to: a) identify the percentage of students engaging in IER within each survey administration, as well as across survey administrations; b) examine the relationship of these indices across survey administrations; and c) identify students who engaged in IER and test whether their inclusion within the data set impacted basic univariate and multivariate statistics for motivational and strategic aspects of SRL.
Participants were students (n = 297) at a large public university in the United States who indicated their ethnicity as White (n = 194, 64%), African-American (n = 41, 13%), Hispanic (n = 22, 7%), Asian (n = 15, 5%), and Other/Multiple (n = 29, 11%). Our sample included a majority of students who were in their first or second year of college (n = 177, 57%), had an average age of 20.4 years (SD = 4.1) and included more males (n = 168, 55%).
Participants were recruited from 16 sections of a three-credit, letter-graded, semester-long elective course designed to improve students’ SRL, and as a result, their overall academic success. As part of their assigned work for the course, students responded to four online SRS. The initial survey solicited information about how students learned about the course, their reasons for taking the course, and their knowledge about other academic outreach resources available through the university. The three remaining surveys, from which the data for the present study are drawn, were designed to assess various dispositions, beliefs, attitudes, and behaviours associated with engagement, learning, and academic success. Three-hundred and five students provided informed consent that allowed for the use of their course data for research, but eight (2.6%) of those students were missing data to an extent that precluded them from inclusion in the present study.
Procedures for each of the three relevant surveys were similar. Within the course’s learning management website, students were provided a short description of the topic and purpose of the survey and concomitant assignment along with a hyperlink. When students clicked the link, a new browser window appeared displaying the first page of the particular Qualtrics-based survey. For the most part, students accessed and completed these surveys outside of the regular class period, at a time and place of their own choosing. As a final step of each survey, students were provided a “Score Report” that included a short description of their own mean scores for the relevant scales. Except for the final survey, these reports served as the basis for a personal reflection assignment and for in-class discussions, which factored into the calculation of the overall course grade. Hence, students’ motivation for completing each survey was likely derived from both their interest in obtaining personal insights regarding their own motivation and strategic behaviour as well as the connection to their course grade.
The three relevant surveys (hereafter referred to as Week 2 Survey, Week 6 Survey, and Week 14 Survey for the weeks that they were assigned during the 15-week semester), each started with a short set of directions (121-171 words) and a few items (e.g. university ID numbers), that later could be used to link them to a particular student. The initial directions identified the general topic of the survey (e.g. motivation), assured the students that there were no right or wrong answers, and provided information about how to ensure they received credit for the associated assignment. The remainder of each survey was organized into sections, each of which began with a few sentences that identified the more specific topic (e.g. self-confidence) it covered, instructed the students to read each item carefully before responding, and reminded students to be honest in their answers. For most items, students were presented with a statement and asked to indicate the extent to which it applied to themselves using a 5-point response scale ranging from Strongly Disagree to Strongly Agree. The self-efficacy for self-regulated learning items, the lone exception to this format, were answered using a 5-point response scale ranging from Not Confident at All to Very Confident.
The Week 2 Survey contained 77 items, organized into seven sections that assessed dispositions, an array of motivational beliefs, and various attitudes and behaviours related to time management and procrastination. The Week 6 Survey consisted of 43 items, organized into four sections, which assessed students’ reported use of various cognitive, metacognitive, and motivational strategies. The Week 14 Survey was designed as a follow-up that would allow students to consider changes in some of their beliefs and behaviours. This final survey included 24 items from the Week 2 Survey and 18 items from the Week 6 Survey, organized into five sections. See Table 1 for a full list of the constructs assessed on each survey, as well as Appendix A for brief descriptions of these constructs and sample items.
Table 1
Description of Surveys
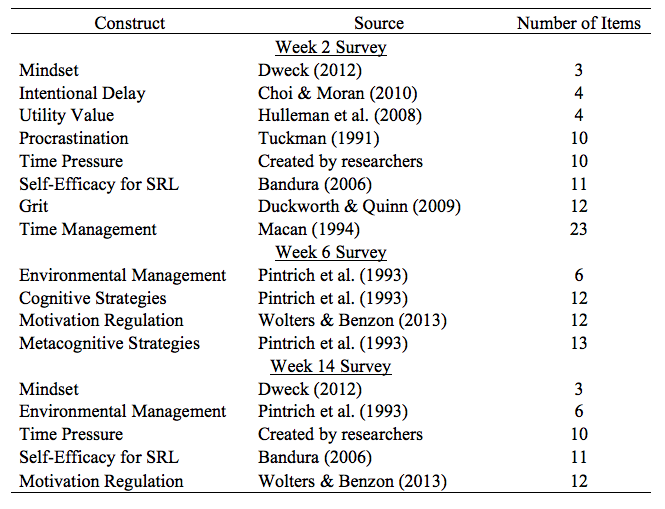
Note: Items on several of the scales were modified
slightly in order to better reflect the particular context and/or
level of specificity. In some cases, additional original items
were also included. SRL = Self-Regulated Learning
2.3.1 IER Indices
Students’ responses to each survey were used to compute four indices designed to assess the extent to which they engaged in IER. These indices were the primary measures used to address our research questions. Each index was computed for each survey, based on the items within that particular survey.
2.3.1.1 Response Time
Students’ total response time for each survey was computed from start (when the “begin” button was clicked) to stop (when the final “submit” button was clicked). This time was automatically and surreptitiously recorded via the Qualtrics software. The total response time then, included all the time that participants used to read the directions, the time taken to read, think about, and respond to all of the items, and any time taken to read the report of their scores on the variables measured in the survey. The total response time also included any time in which the students had the survey open and active but were not actively working to complete it (e.g. were distracted).
In our effort to identify students who engaged in IER, we considered only excessively short response times. An exact minimal amount of time considered necessary for properly responding to any particular survey is difficult to determine. Huang et al. (2012) recommended a cutoff score of two seconds per item as a means of detecting IER. However, unlike surveys examined in much of the recent IER research, our surveys contained not only items and response options, but also directions and descriptions of each variable being assessed. To account for the additional time needed to read and consider all of this material, we elected to use a method of determining a cutoff score based upon expected reading rates. Carver (1982) found that the average college student can read and comprehend about 300 words per minute (wpm). Based on this rate, we computed the minimal amount of time that a student might be expected to spend completing each survey and used it to establish distinct cutoff scores for each (see Table 2).
2.3.1.2 Individual Response Variability (IRV)
The IRV index (Dunn et al., 2016) was computed by calculating a standard deviation for all items on a specific survey for each individual participant. The IRV index is sensitive to both long-string responses and less obvious forms of IER evidenced by low variability among responses (e.g. answering 4,5,4,5,4,5). Values of the IRV index could range from zero to 2.5 (the highest maximum standard deviation given our response options).
Lower values on the IRV represent less variability among a participant’s responses and are interpreted as greater engagement in IER. That is, when respondents use a restricted response set like in the example above, their IRV index score will be lower and thus indicative of IER. However, no established cutoff score for IER detection exists for this index. We elected to use 2 SDs below the mean IRV score for all participants as our cutoff criteria. Based on the assumption of a normal distribution, this cutoff value is rather conservative, as less than three percent of scores would be expected to fall below this value.
2.3.1.3 Psychometric Synonyms (PS)
The PS index was computed as a respondent’s average bivariate correlation for the set of items found to have the strongest correlations for the total sample (e.g. “I constantly worry about how little time I have for completing my assignments” and “I stress a lot about not having the time I need for my coursework”) . The criteria for identifying the set of item pairs to use in the computation of the PS index is not absolute. Some have suggested identifying a particular number of item-pairs with the strongest bivariate correlations (Johnson, 2005), while others have suggested using a specific threshold for the magnitude of the correlations used in this computation (|.60|; Meade & Craig, 2012). Given the length of our surveys and the recommendation that items not be repeated when considering what item pairs to use in this computation (Curran, 2016), we computed a PS index using the 10 non-repeating pairs on each survey with the strongest, positive bivariate correlations for the sample. The PS index could range from -1 to 1 with lower scores interpreted as increased engagement in IER. However, because there is no consensus as to what value unequivocally indicates that students have engaged in IER we again elected to use 2 SDs below the mean value for the sample as a cutoff value.
2.3.1.4 Even-Odd Consistency (E-O)
The E-O index (Huang et al., 2012; Johnson, 2005; Meade & Craig, 2012) is computed as a participant’s correlation for the set of even and odd item-pairs that assess the same underlying construct (e.g., grit item #1 & grit item #2). The E-O index was computed using 37 item-pairs for the Week 2 Survey, 21 item-pairs for the Week 6 Survey, and 19 item-pairs for the Week 14 Survey. The range of the E-O index is also between -1 and 1, with lower scores interpreted as reflecting greater engagement in IER. Although a specific cutoff value for this index has been suggested (.30 by Jackson, 1977, as cited in Johnson, 2005), this value has not been used consistently in other IER research. Thus, to maintain consistency with the IRV and PS indices, we used 2 SDs below the sample mean for this index as the cutoff value to categorize students as engaging in IER.
Table 2
Indices, Cutoff Scores, and Number of Participants Identified as Engaging in IER
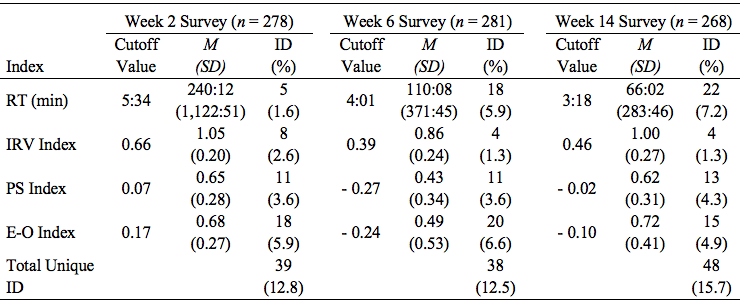
Note. The ID column represents the number of participants
identified as engaging in IER for each method. The Total Unique ID
row represents the number of individual students that engaged in
IER as indicated by at least one method. It was possible (and
happened to be) that a student could be identified as engaging in
IER by more than one index. RT = Response Time. IRV = Individual
Response Variability. PS = Psychometric Synonyms. E-O = Even-Odd
Consistency
Our first research question concerned the prevalence of IER exhibited by students who completed each of the three relevant SRS. As a first step in addressing this question, Table 2 provides the specific cutoff scores used to identify IER, the average score for each index, as well as how many students were identified as engaging in IER for each survey, based on each of the four indices utilized. Based on at least one of the indices, 12.8% of students who completed the Week 2 Survey, 12.5% of students who completed the Week 6 Survey, and 15.7% of students who completed the Week 14 Survey were identified as having engaged in IER. Overall, out of 827 survey administrations, 15.1% displayed some evidence of IER.
3.2.1 Index Consistency
Our second research question concerned the consistency of IER across survey administrations. We conceptualized consistency in two ways. First, we considered the consistency of students’ values for each particular index across the three surveys. Regarding the consistency of index values across survey administrations, Table 3 displays mixed evidence. Most apparent, the values of the IRV index showed moderate to strong correlation with one another (rs > .43). These correlations indicate that students were somewhat consistent in whether their responses were tightly centred around a particular response option (e.g. the midpoint) or whether they tended to be more varied in the response options they selected across surveys. Students’ general tendency to respond to the selected item pairs in a way that was consistent with the overall sample (i.e., the PS index) was neither exceptionally strong nor consistent.
Table 3
Correlations among IER Index Values

Note. RT = Response Time. IRV = Individual Response
Variability. PS = Psychometric Synonyms. E-O = Even-Odd
Consistency. Correlations in bold indicate the relationship
between corresponding indices across surveys. * p < .05. ** p
< .01.
E-O values between any of the surveys were not correlated even though, similar to the PS index, this index is a method of assessing individual response reliability. As well, evidence of consistency in the amount of time it took students to complete each survey was weak and inconsistent. That is, students who exhibited longer (or shorter) response times on one survey were no more or less likely to exhibit longer (or shorter) response times when completing the other surveys.
3.2.2 Person Consistency
As a second method of assessing consistency, we also considered whether the IER behaviour is something that students consistently engage in or is more of a one-off, situational behaviour. We examined this by looking at students who were identified as engaging in IER, by at least one index on one survey, and seeing if they were identified as engaging IER on one of the other survey administrations. Of the 297 students in our sample, just one was identified as engaging in IER on all three surveys. Further, only 27 students (9%) were identified as engaging in IER on two of the three surveys. Of those students who were identified as engaging in IER on more than one SRS, 64% were identified by the same index on the surveys in which they were deemed inattentive. These results suggest that engagement in IER is not a consistent behaviour and, therefore, may likely be more dependent upon situational factors, such as fatigue or being distracted. When students do engage in IER repeatedly though, they tend to be inattentive in the same manner in which they had previously been inattentive.
Our third and most critical research question concerned whether students’ engagement in IER had an appreciable impact on basic analyses that involved the SRL and motivation variables assessed by each survey. We evaluated whether the inclusion (or exclusion) of students categorized as engaging in some form of IER in the sample altered key psychometric and descriptive properties of the motivation and SRL variables and would thus alter how this data would be interpreted. Further, we compared groups of students categorized as Attentive and Inattentive for each survey.
Table 4
Differences between the Total Sample, Attentive, and Inattentive Students on SRL Variables
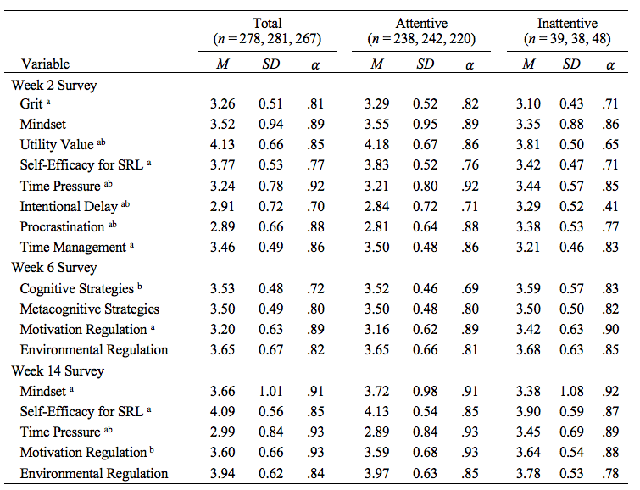
Note. n = Week 2 Survey, Week 6 Survey, Week 14 Survey;
SRL = Self-regulated learning.
a Significant mean level difference between Attentive
and Inattentive (p < .001).
b Significant Cronbach’s alpha difference between
Attentive and Inattentive (p < .05).
3.3.1 Internal Consistency of SRL Scales
Table 4 displays Cronbach’s alpha for each of the substantive measures of SRL and motivation across the three surveys for the Total sample (both Attentive and Inattentive students) as well as for Attentive and Inattentive (i.e. were identified as engaging in IER) students separately. We conducted Feldt’s tests (Feldt et al., 1987; Diedenhofen & Musch, 2016) to evaluate the observed differences in the reliability of the SRL scales computed for these three groups. Most notably, there was no statistical difference in the reliabilities computed for the Total and Attentive students. That is, the internal consistency of the SRL and motivation scales remained essentially the same, regardless of whether Inattentive students were or were not included in the computations.
In contrast, some differences in the internal consistency of these variables was observed when comparing Attentive and Inattentive students. On the Week 2 Survey, compared to Inattentive students, reliabilities for the Attentive students were significantly higher (p < .05) for four of the eight scales assessed (utility value, time pressure, intentional delay, and procrastination). In contrast, on the Week 6 Survey, Inattentive students had higher internal consistency for one of the four scales assessed (cognitive strategies). On the Week 14 survey, Attentive students had significantly higher consistency on two of the five scales assessed (time pressure and motivation regulation).
3.3.2 Mean response for SRL Scales
Table 4 also displays means and standard deviations for the Total sample, Attentive, and Inattentive students for each of the SRL and motivation scales on each of the three surveys. Based on independent t-tests, we found no statistical differences in the means for any of the SRL or motivation scales when comparing Total and Attentive students (ps > .16). Again, the inclusion of Inattentive students did not meaningfully change the computation of these basic descriptive statistics.
In contrast, there were several observed differences in mean scores for Attentive and Inattentive students. On the Week 2 survey, Attentive and Inattentive students showed significantly different means (p < .001) on utility value, self-efficacy for SRL, and time management (MAttentive > MInattentive), as well as intentional delay and procrastination (MInattentive > MAttentive). No significant differences in means were found for the scales on the Week 6 Survey. On the Week 14 Survey, Inattentive students reported significantly higher time pressure than did Attentive students. The observed significant differences between Attentive and Inattentive students on the SRL and motivation scales across all surveys was medium to large, based on computed effect sizes (Hedges’ g > .57).
< i> 3.3.3 Relations among SRL Scales
Using Fisher’s r to z transformation, we examined differences between the Total sample, Attentive, and Inattentive students in their patterns of correlations among the substantive SRL and motivation measures. Consistent with the findings on internal consistency and means, there were no significant differences in the correlations between SRL variables when comparing Total and Attentive students (zs > |.65|). Put differently, the removal of students who were identified as not providing the necessary cognitive effort needed to complete the SRS did not impact the bivariate relations between the SRL and motivation variables.
Again, we did find several differences between Attentive and Inattentive students regarding their correlations between SRL and motivation scales. On the Week 2 Survey, Attentive and Inattentive students had significantly different (p < .05) correlations between self-efficacy for SRL and grit, time management and procrastination, and grit and intentional delay (stronger correlations for Attentive students), as well as between intentional delay and mindset and utility value and time pressure (stronger correlations for Inattentive students). On the Week 6 Survey, Inattentive students had significantly stronger correlations between cognitive strategies and environmental management, as well as motivation regulation and metacognitive strategies. On Week 14 Survey, the only significant different in correlations between Attentive and Inattentive students was between motivation regulation and environmental management, in which Inattentive students displayed a stronger correlation.
Despite their acknowledged limitations, SRS have been and remain, the most common form of assessment used to investigate SRL (Winne & Perry, 2000; Wolters & Won, 2018). Adding to this overall trend, the increasing use of online surveys continues to add to the concerns about the validity of the SRS data used to understand SRL (Karabenick & Zusho, 2011; Schellings & van Hout-Wolters, 2011; Winne & Jamieson-Noel, 2003). One major threat to validity that is consistently highlighted when considering these types of assessments is that participants do not engage in the necessary cognitive processes required to provide responses that are a valid representation of their true beliefs, attitudes, and behaviours (Duckworth & Yeager, 2015; Schwartz & Oyserman, 2001). Respondents that are inattentive or provide insufficient effort when responding to survey items are seen as corrupting influences on the resulting data that ultimately lead to invalid conclusions (Huang et al., 2015; Curran, 2016).
Our primary goal was to evaluate whether responses from inattentive students are prevalent enough to degrade the quality of data produced from SRS designed to assess key aspects of SRL and thus alter any inferences made from it. We pursued this goal by addressing three related questions about college students’ engagement in IER on three SRS designed to assess multiple factors associated with SRL. In the remainder of this section, we discuss findings with regard to these questions, identify paths for future research, and make suggestions to researchers about ways they can assess the quality of data derived from online SRS.
Our first objective was to evaluate the extent to which college students engaged in IER when responding to SRS designed to assess motivational and strategic aspects of SRL. Across three surveys administered over the course of a semester, we found a rate of IER (about 15%) using four common post hoc indices of IER that were similar to prior IER research (Meade & Craig, 2012; Maniaci & Roegge, 2014; Bowling et al., 2016; DeSimone & Harms, 2017). Much of the prior research has been conducted using personality or job-related surveys, typically on instruments with over 100 items. Our findings, therefore, support an extension of this work by demonstrating similar levels of engagement in IER when surveys are shorter and designed to assess constructs more central to the study of SRL. Hence, the theoretical content of the items may not have a strong influence on how likely respondents are to engage in IER. Perhaps even more remarkable, this consistency was found even when students were expected to have a greater personal investment in responding to items in a careful and attentive manner. Students were reminded repeatedly that the information they provided would be used for a class assignment and that it, in turn, would serve to support their positive growth and development as a student. While we assume that we were working with a more motivated sample, future research should manipulate the personal investment respondents have for responding to items and test whether this leads to differences in IER behaviours.
Our findings also exposed interesting differences based on the methods used to identify students who engaged in IER. Across survey administrations, IER was most likely to be identified based on students’ score on the E-O index, followed closely by their response time. The use of the E-O consistency index, a measure of a respondent’s consistency when answering items on the same scale, is primarily a check on random responding to conceptually similar items. The comparatively high proportion of students identified by this method suggests that the type of IER most common in SRL research may be more nefarious than simply speeding through the SRS or repeatedly answering with the same response option. This finding highlights the need to use more sophisticated indices to evaluate IER, rather than simply “eye-balling” SRS data for overt instances of inattentive responding.
Of the reactive methods used to identify IER, response time is arguably the most objective measure because it is founded on a less debatable premise. In particular, this method is based on the straightforward assumption that there is some minimum amount of time needed to process written text and provide a response. Based on Carver's (1982) estimation for college students, and unlike previous studies, we used reading rate to determine an IER cutoff score for response time. It provides the advantage of considering all of the reading that accompanies taking an SRS (directions, explanations of items), factors that are unaccounted for when using Huang et al.’s (2012) recommendation of two seconds per item. Even with the advantages of using reading rate, this method of determining a cutoff score should be viewed as conservative because it does not directly consider the amount of time that a respondent would need to thoughtfully reflect upon and answer the item
Fewer students were identified as engaging in IER using the PS and IRV indices. This may be in part due to the length of the surveys we examined, as well as how the IER cutoff was determined. Previous studies that have used the IRV index identified a certain percentage of students (10%) with the lowest IRV index score to be inattentive (Dunn et al., 2016; DeSimone & Harms, 2017). Rather than predetermine the exact percent of students who must be engaged in IER, we chose instead to use a cutoff value (-2 SD) that is commonly used as a criterion for identifying extreme outliers in a normal distribution of scores. This criterion may underestimate who should be categorized as engaging in IER. However, as the IRV index is a relatively new method of detecting IER, more work needs to be done in order to understand its proper utilization as a method of detecting IER. In particular, evaluation of the best criteria to use for determining which students are engaged in IER would be useful.
The length of our surveys made finding items to use in calculating the PS index difficult, especially given the recommendation that items only be used once (Curran, 2016). Consequently, in order to create a reliable coefficient, we were forced to rely on only the highest, non-repeating item-pair correlations, some of which had somewhat modest correlations. The length and nature of our surveys also made it so that we could not compute a psychometric antonym index, which is typically used in conjunction with the PS index. It may be that these indices are not useful measures of IER when assessing multiple distinct constructs using scales with a relatively low number of items as is typical within the research examining SRL. Put differently, the PS index may prove more valuable for identifying IER when using scales with larger sets of items to assess cohesive underlying constructs.
Overall, these findings provide additional support for the recommendation that researchers utilize multiple indices to identify respondents who engage in IER (Huang et al., 2012; Meade & Craig, 2012). Within each survey, we found that the various indicators of IER had, at best, weak to moderate positive correlations with one another. Further, we found that very few students were identified as engaging in IER by more than one index on any particular survey. In fact, of the 125 students who were identified as being inattentive, only 14 were flagged by two or more indices within a particular survey. Overall, these findings are in line with the assumption that inattention or insufficient effort may be manifested in a variety of ways (Curran, 2016; DeSimone & Harms, 2017; Huang et al., 2012) and therefore any single method of detecting IER will fall short of identifying all the participants who engage in IER.
Our second objective was to examine the consistency of students’ engagement in IER across survey administrations. That is, we sought preliminary evidence of whether students’ engagement in IER was more or less stable across the three surveys. As a first check on this issue, we found that the pattern of correlations between the same IER indices across different surveys was inconsistent. For example, the IRV indices across survey administrations were moderately correlated, whereas the other indices showed a much lower level of consistency. The most immediate implication of these findings is that students do not engage in certain forms of IER on a consistent basis. As well, this pattern of findings has implications for the potential causes of students’ engagement in IER. If stable individual differences played a dominant role, one would expect that those students who, for example, had very quick response times on the Week 2 Survey would also display very quick response times on the Week 6 and Week 14 Surveys. In contrast, greater variability suggests that students’ engagement in the various forms of IER may be the result of situational factors that are more likely to change between surveys.
Further corroboration for the importance of situational influences on inattentive survey behaviour comes from our evaluation of whether particular students or groups of students were more likely to be identified as engaging in IER. The “recidivism rate” of IER was very low; only one student was identified as engaging in IER on each of the three surveys and less than 10% of students were two-time offenders. Further, we found that no specific group of students, be those based on sex, ethnicity/race, year in school, or academic probation status, were more likely than another to be identified as engaging in IER. One more general interpretation of our findings, therefore, is that students’ IER behaviour is influenced more strongly by situational features linked to a particular survey rather than by more stable demographic or individual characteristics, such as personality variables (cf. Dunn et al., 2016). Further, this conclusion suggests that the best index to use in evaluating the presence of IER should be tied to expectations about the situational factors and the type of unwanted behaviour they are likely to promote.
Our findings regarding the consistency of IER are slightly discordant with Bowling et al. (Study 1; 2016), who also studied IER consistency across different SRS administrations. Noteworthy differences in the population studied, the constructs assessed, and the nature of the repeated SRS administration make direct comparisons of these studies difficult to reconcile. Despite this, both studies suggest that IER consistency is a function of the type of survey administered, the sample answering the survey, and perhaps most importantly, situational factors (e.g. a transient environmental distraction) that influence the attention and effort participants provide when answering survey items.
Finally, and most critically, our findings indicate that including data from students who were deemed inattentive during the assessment process did not dramatically alter the results of some basic quantitative analyses. We compared Cronbach’s alphas, means, standard deviations, and correlations of the substantive motivation and SRL measures in each survey for the Total sample (Attentive and Inattentive students) with those for only the Attentive students. Across all survey administrations, no statistically significant differences emerged. That is, the inclusion of the data from students identified as inattentive did not appear to corrupt basic analyses computed for the whole sample that are fundamental to studies of motivation and SRL. Participants who engage in IER, therefore, may add “noise” to the overall set of data (see below) but their presence does not appear to substantially corrupt the overall “signal” when considering these fundamental statistics.
Despite this overall lack of corruption, however, it would be inaccurate to say that inattentive and attentive students provided equivalent data. We found an array of significant mean-level, reliability, and correlational differences when comparing the Attentive and Inattentive students. A closer examination of these findings does not expose a simple or obvious pattern. In some instances, Attentive students displayed higher means, reliability, and correlation coefficients, whereas in others, this pattern was reversed. Attentive students displayed higher values for the more “desirable” motivational and SRL constructs, such as self-efficacy for SRL and time management, while also displaying lower values for less adaptive constructs such as procrastination. This pattern does not hold for all variables however, as inattentive students displayed higher mean levels of motivation regulation and higher internal consistency in their use of cognitive strategies than did Attentive students. In sum, we found clear evidence that the methods we used to evaluate IER identified some students who provided atypical response patterns that resulted in differences in some fundamental descriptive properties of the data. The way in which inattentive responding influences assessment of the underlying constructs, however, was not straightforward and needs further investigation.
In spite of the clear response set differences between Attentive and Inattentive students, our finding that the presence of data contributed by these inattentive students did not substantially degrade the quality of data collected or observed relations when assessing SRL should provide some relief to researchers. That is, our findings indicate that interpretations of past SRL research based on SRS may be relatively sound, in spite of the likelihood that there are instances of IER within the relevant data. Further, our findings suggest that elaborate screening techniques, such as latent profile analysis (Shukla & Konold, 2018) or lengthy infrequency scales (Maniaci & Rogge, 2014) may not be necessary to use when trying to ensure the validity of students’ self-reported motivation and use of self-regulated learning strategies.
As with any exploratory research, there are several limitations to this study. The first limitation is the attrition of students over the course of the semester. The context in which our surveys were administered, as part of the coursework for a college elective course, meant that our access to students was dependent upon their continued enrollment and participation in the course. The Week 14 Survey, administered at the end of the semester, had the fewest number of participants, which is likely due to a decrease in enrollment and participation over the course of the semester. It is possible that we were unable to examine a sub-group of students who are more likely to engage in IER, those students who dropped the course or simply did not take the survey. A related limitation comes from our total sample size, just under 300 students. This modest sample size prevents strong conclusions about the generalizability of our results. Rather, our results should be viewed as an initial step to more explicitly evaluate the potential limitations of SRS data in SRL research.
The second limitation relates to the IER indices used. The post hoc nature of this analysis precluded us from using proactive methods of identifying IER, which have been shown to be useful in this line of research (Huang et al., 2012; Meade & Craig, 2012; Maniaci & Rogge, 2014; Huang et al., 2015). The use of response time as an indicator of IER is limited to only identifying respondents who answer too quickly. As of now, there is no agreed upon way to assess whether respondents who take too long to answer a survey are engaging in IER. Finally, our cutoff scores (300 wpm for response time and -2 SDs for the IRV, PS, E-O indices) have not been previously used to identify IER. We chose to utilize these cutoffs with the hope of providing a quick and simple metric to determine IER, without the use of elaborate statistical techniques, so that detecting IER may become a standard part of the data-cleaning process, such as looking for outliers or missing data. It is possible however that our simple cutoff scores reduce the complexity inherent in identifying IER.
Our findings point to a number of additional lines of research that should be pursued in order to better understand IER and the conditions under which it may inhibit researchers’ abilities to draw valid conclusions from their data. Ultimately, it would be beneficial for researchers to routinely compute and report a small set of easily understood indices, including both proactive and reactive indices, which would provide a ready metric regarding the extent to which IER is an issue within any particular set of data. Based on our measures and results, we see the E-O index and response time as easily computable, effective indices for detecting IER in SRL-related data sets. Additional research is necessary to determine the usefulness of the PS index and IRV index in these types of data sets. Beyond these indicators of IER, the implication that situational forces seem to play a more prominent role in the extent to which a respondent will engage in IER supports the need for more work to better understand the conditions that lead to more and less attentive responding by participants.
Along these lines, we also suggest that researchers should provide more detailed descriptions of the conditions under which respondents’ complete SRS, such as we have done in this paper (see section 2.2 Procedures), so that others can evaluate the extent that IER may be an issue. For example, providing information regarding specific instructions given to respondents, any incentives that respondents have to answer the SRS, and whether the SRS is completed in the presence of a researcher or without supervision, are several factors that may influence the likelihood of IER being present with collected data. In this way, typical issues such as fatigue, interest in content, distractions, along with more subtle factors such as surveillance and expected feedback can be better investigated for their impact on participants’ response behaviours. It is also worth noting that the work investigating IER needs to encompass both experimental and more “naturalistic” designs. Experimental studies in which researchers purposefully manipulate aspects of the assessment process in order to consider their effects on participants’ response behaviours is essential for establishing causal connections. At the same time, studies of IER when participants complete research surveys under more typical and less controlled conditions (e.g., our sample) also are necessary for more ecologically valid conclusions.
Although they remain a popular choice for researchers, there are a number of important limitations that threaten the validity of using SRS to investigate SRL (Karabenick & Zusho, 2011; Schellings & Van Hout-Wolters, 2011; Winne & Jamieson-Noel, 2003). In the present study, we focused on evaluating just one of these critiques, that students’ inattention or insufficient effort while completing the items on SRS will substantially reduce the integrity of the resulting data and, therefore, its usefulness for investigating SRL. Our findings lead to two overall insights regarding this critique. On the one hand, we found evidence that a notable proportion of students engaged in IER and, as a result, produced data with some basic statistical properties that were inconsistent with those produced by students who appeared to complete the surveys more thoughtfully. On the other hand, we also found evidence that the irregular response patterns or “noise” contributed by the students who engaged in IER did not corrupt the data to an extent that basic “signals” or statistical properties were lost or debased. In sum, researchers examining SRL should likely consider IER more as a nuisance that should be reduced whenever and in as many ways as possible, rather than as fatal flaw that precludes the use of SRS as a viable methodology.
Azevedo, R., Taub, M., & Mudrick, N.V. (2018). Using
multi-channel trace data to infer and foster self-regulated
learning between humans and advanced learning technologies. In D.
Schunk & Greene, J.A (Eds.), Handbook of self-regulation
of learning and performance (2nd ed., pp. 254-270). New
York, NY: Routledge.
Bandura, A. (2006). Guide for constructing self-efficacy scales.
In Self-efficacy beliefs of adolescents (pp. 307–337).
https://doi.org/10.1017/CBO9781107415324.004
Beach, D. A. (1989). Identifying the random responder.Journal
of Psychology: Interdisciplinary and Applied, 123(1),
101–103. https://doi.org/10.1080/00223980.1989.10542966
Biswas, G., Baker, R,, & Paquette, L. (2018). Data mining
methods for assessing self-regulated learning. In D. H. Schunk
& J. A. Greeene (Eds.),Handbook of self-regulation of
learning and performance (2nd ed., pp. 388 - 403).
New York: Routledge.
Bowling, N. A., Huang, J. L., Bragg, C. B., Khazon, S., Liu, M.,
& Blackmore, C. E. (2016). Who cares and who is careless?
Insufficient effort responding as a reflection of respondent
personality. Journal of Personality and Social Psychology,
111(2), 218-229. https://doi.org/10.1037/pspp0000085
Butler, D. L. (2002). Qualitative approaches to self regulated
learning: Contributions and challenges. Educational
Psychologist, 37, 59–63.
https://doi.org/10.1207/S15326985EP3701
Carver, R.P. (1992). Reading rate: Theory, practice, and practical
mplications. Journal of Reading, 36(2), 84-95.
Choi, J. N., & Moran, S. V. (2010). Why not procrastinate?
Development and validation of a new active procrastination scale
why not procrastinate. The Journal of Social Psychology,
149, 37–41. https://doi.org/10.3200/SOCP.149.2.195-212
Cleary, T. J, & Callan, G. (2018). Assessing self-regulated
learning using microanalytic methods. In D. H. Schunk & J. A.
Greene (Eds.), Handbook of self-regulation of learning and
performance (2nd ed.). New York: Routledge.
Cleary, T. J., & Zimmerman, B. J. (2004). Self-regulation
empowerment program: A school-based program to enhance
self-regulated and self-motivated cycles of student learning. Psychology
in the Schools, 41(5), 537–550.
https://doi.org/10.1002/pits.10177
Costa, P. T., & McCrae, R. R. (2008). The revised NEO
personality inventory (NEO-PI-R). In The SAGE Handbook of
Personality Theory and Assessment: Volume 2 - Personality
Measurement and Testing (pp. 179–198). London: SAGE
Publications Ltd. https://doi.org/10.4135/9781849200479.n9
Curran, P. G. (2016). Methods for the detection of carelessly
invalid responses in survey data. Journal of Experimental
Social Psychology, 66, 4–19.
https://doi.org/10.1016/j.jesp.2015.07.006
DeSimone, J. A., & Harms, P. D. (2017). Dirty data: The
effects of screening respondents who provide low-quality data in
survey research. Journal of Business and Psychology,
1–19. https://doi.org/10.1007/s10869-017-9514-9
Diedenhofen, B., & Musch, J. (2016). cocron : A web interface
and R package for the statistical comparison of Cronbach ’ s alpha
coefficients. International Journal of Internet Science,
11(1), 51–60.
http://www.ijis.net/ijis11_1/ijis11_1_diedenhofen_and_musch.pdf
Dignath, C., & Büttner, G. (2008). Components of fostering
self-regulated learning among students. A meta-analysis on
intervention studies at primary and secondary school level. Metacognition
and Learning, 3(3), 231–264.
https://doi.org/10.1007/s11409-008-9029-x
Duckworth, A. L., & Quinn, P. D. (2009). Development and
validation of the short grit scale ( Grit – S ). Journal of
Personality Assessment, 3891, 166–174.
https://doi.org/10.1080/00223890802634290
Duckworth, A. L., & Yeager, D. S. (2015). Measurement matters:
Assessing personal qualities other than cognitive ability for
educational purposes. Educational Researcher, 44
(4), 237–251. https://doi.org/10.3102/0013189X15584327
Dunn, A. M., Heggestad, E. D., Shanock, L. R., & Theilgard, N.
(2016). Intra-individual response variability as an indicator of
insufficient effort responding: Comparison to other indicators and
relationships with individual differences. Journal of
Business and Psychology, 1–17.
https://doi.org/10.1007/s10869-016-9479-0
Dweck, C. (2012). Mindset: How You Can Fulfil Your Potential.
London: Robinson.
Feldt, L. S., Woodruff, D. J., & Salih, F. a. (1987).
Statistical inference for coefficient alpha. Applied
Psychological Measurement, 11(1), 93–103.
https://doi.org/10.1177/014662168701100107
Huang, J. L., Curran, P. G., Keeney, J., Poposki, E. M., &
DeShon, R. P. (2012). Detecting and deterring insufficient effort
responding to surveys. Journal of Business and Psychology,
27(1), 99–114. https://doi.org/10.1007/s10869-011-9231-8
Huang, J. L., Liu, M., & Bowling, N. A. (2015). Insufficient
effort responding: Examining an insidious confound in survey data.
Journal of Applied Psychology, 100(3), 828–845.
https://doi.org/10.1037/a0038510
Hulleman, C. S., Durik, A. M., Schweigert, S. A., &
Harackiewicz, J. M. (2008). Task values, achievement goals, and
interest: An integrative analysis. Journal of Educational
Psychology, 100(2), 398–416.
https://doi.org/10.1037/0022-0663.100.2.398
Johnson, J. A. (2005). Ascertaining the validity of individual
protocols from web-based personality inventories. Journal of
Research in Personality, 39, 103–129.
https://doi.org/10.1016/j.jrp.2004.09.009
Karabenick, S. A., & Zusho, A. (2011). Examining approaches to
research on self-regulated learning: conceptual and methodological
considerations. Metacognition and Learning, 10
(1), 151–163. https://doi.org/10.1007/s11409-015-9137-3
Macan, T. H. (1994). Time management: Test of a process model. Journal
of Applied Psychology, 79(3), 381–391.
https://doi.org/10.1037/0021-9010.79.3.381
Maniaci, M. R., & Rogge, R. D. (2014). Caring about
carelessness: Participant inattention and its effects on research.
Journal of Research in Personality, 48(1),
61–83. https://doi.org/10.1016/j.jrp.2013.09.008
McCardle, L., & Hadwin, A. F. (2015). Using multiple,
contextualized data sources to measure learners’ perceptions of
their self-regulated learning. Metacognition and Learning,
10(1), 43–75. https://doi.org/10.1007/s11409-014-9132-0
McKibben, W. B., & Silvia, P. J. (2017). Evaluating the
distorting effects of inattentive responding and social
desirability on self-report scales in creativity and the arts. Journal
of Creative Behavior, 51(1), 57–69.
https://doi.org/10.1002/jocb.86
Meade, A. W., & Craig, S. B. (2012). Identifying careless
responses in survey data. Psychological Methods, 17(3),
437–455. https://doi.org/10.1037/a0028085
Nichols, D. S., Greene, R. L., & Schmolck, P. (1989). Criteria
for assessing inconsistent patterns of item endorsement on the
MMPI: Rationale, development, and empirical trials. Journal
of Clinical Psychology, 45(2), 239–250.
https://doi.org/10.1002/1097-4679(198903)45:2<239::AID-JCLP2270450210>3.0.CO;2-1
Panadero, E. (2017). A review of self-regulated learning: Six
models and four directions for research. Frontiers in
Psychology, 8(APR), 1–28.
https://doi.org/10.3389/fpsyg.2017.00422
Pajares, F. (2007). Motivational role of self-efficacy beliefs in
self-regulated learning. In B. J. Zimmerman, & D. H. Schunk
(Eds .), Motivation and Self-Regulated Learning: Theory,
Research, and Applications (pp. 111-140). New York:
Erlbaum.
Perry, N. E., Hutchinson, L. R., Yee, N., & Maatta, E. (2018).
Advances in understanding young children’s self-regulation of
learning. In D. H. Schunk & J. A. Greeene (Eds.), Handbook
of self-regulation of learning and performance (2nd ed.).
New York: Routledge.
Pintrich, P. R., Smith, D. A. F., Garcia, T., & Mckeachie, W.
J. (1993). Reliability and predictive validity of the motivated
strategies for learning suestionnaire (MSLQ). Educational and
Psychological Measurement, 53(3), 801–813.
https://doi.org/10.1177/0013164493053003024
Pintrich, P. R., & Zusho, A. (2007). Students’ motivation and
self-regulated learning in the college classroom. In R. P. Perry
& J. C. Smart (Eds.), The scholarship of teaching and
learning in higher education: An evidence based perspective
(pp. 731–810). New York: Springer.
Schellings, G., & van Hout-Wolters, B. (2011). Measuring
strategy use with self-report instruments: Theoretical and
empirical considerations. Metacognition and Learning, 6(2),
83–90. https://doi.org/10.1007/s11409-011-9081-9
Schunk, D. H., & Zimmerman, B. J. (1998). Self-regulated
learning: From teaching to self-reflective practice . Psychological
Science. Guilford Press.
Schwarz, N., & Oyserman, D. (2001). Asking questions about
behaviour. American Journal of Evaluation, 22(2),
127–160. https://doi.org/10.1177/109821400102200202
Shukla, K., & Konold, T. (2018). A two-step latent profile
method for identifying invalid respondents in self-reported survey
data. Journal of Experimental Education, pp. 1–16.
https://doi.org/10.1080/00220973.2017.1315713
Tuckman, B. W. (1991). The development and concurrent validity of
the procrastination scale. Educational and Psychological
Measurement, 51(2), 473–480.
https://doi.org/10.1177/0013164491512022
Usher, E., & Schunk, D. H. (2018). Social cognitive thoretical
perspective of self-regulation. In D. H. Schunk & J. A. Greene
(Eds.), Handbook of self-regulation of learning and
performance (2nd ed.). New York: Routledge.
Winne, P. H., & Hadwin, A. F. (2008). The weave of motivation
and self-regulated learning. In D. H. Schunk & B. J. Zimmerman
(Eds.), Motivation and self-regulated learning: Theory,
research, and applications (pp. 297–314). Mahwah, NJ:
Erlbaum Associates.
Winne, P. H., & Jamieson-Noel, D. (2003). Self-regulating
studying by objectives for learning: Students’ reports compared to
a model. Contemporary Educational Psychology, 28
(3), 259–276. https://doi.org/10.1016/S0361-476X(02)00041-3
Winne, P. H., & Perry, N. E. (2000). Measuring self-regulated
learning. In Handbook of Self-Regulation (pp. 531–566).
Elsevier. https://doi.org/10.1016/B978-012109890-2/50045-7
Wolters, C. A., & Benzon, M. B. (2013). Assessing and
predicting college students use of strategies for the
self-regulation of motivation. Journal of Experimental
Education, 81(2), 199–221.
https://doi.org/10.1080/00220973.2012.699901
Wolters, C. A., & Won, S. (2018). Validity and the use of
self-report questionnaires to assess self-regulated learning. In
D. H. Schunk & J. A. Greeene (Eds.), Handbook of
self-regulation of learning and performance (2nd ed.). New
York: Routledge.
Zimmerman, B. J. (2008). Investigating self-Regulation and
motivation: Historical background, methodological developments,
and future prospects. American Educational Research Journal,
45(1), 166–183. https://doi.org/10.3102/0002831207312909

a Items were repeated to create Week 14