![]()
Frontline Learning Research Vol.8 No. 4 (2020) 52
- 73
ISSN 2295-3159
aDepartment of Foundations of
Education, Virginia Commonwealth University, USA
Article received 12 June 2019 / revised 9 December / accepted 4 March 2020/ available online 17 July
In this study, we examine the extent to which the discrepancy between teacher-reported and student-reported self-regulatory behaviours during writing were associated with students’ end-of-year writing grades after controlling for student writing ability and other demographic characteristics. Results of our study, conducted with a sample of 201 middle grades students enrolled in a large, comprehensive suburban school district in the Mid-Atlantic U.S., suggest a significant and positive relationship between teacher discrepancy and grades, after controlling for writing ability, student self-regulation, gender, race/ethnicity, and SES. This has clear implications for the classroom, as it suggests that even after accounting for student difference in terms of ability background, and demographics, the effort that teachers perceive their students making in the fall are still associated with students’ year-end performance in their class. This represents some of the first frontline evidence of the predictive relationship between self-regulation discrepancy and student achievement in writing.
Keywords: Literacy; Self-Regulation; Achievement; Teaching; HLM
At least since Rosenthal and Jacobson’s (1968) publication of Pygmalion in the Classroom, researchers, educators, and the popular media have been interested in the role that teacher expectations play in relation to student academic performance. Depending upon the research examined or the person describing the research, teacher expectations may either have a substantial impact on later student achievement (often referred to as the “self-fulfilling prophecy” effect), or they may have a trivial impact (Jussim & Harber, 2005). As Jussim and Harber (2005) point out, the reality is somewhere between these two extremes; teacher expectations do seem related to student achievement in certain circumstances. In this study, we examine the relationship between teacher expectations and student grades in one circumstance - the extent to which teachers’ discrepant expectations of students’ self-regulatory behaviors during writing were associated with students’ writing grades, after controlling for writing ability and student background characteristics. As the use of observational rating scales that measure students’ self-regulatory behaviors continues to increase in K-12 classrooms (Duckworth & Yeager, 2015), the study of how student and teacher perceptions of these behaviors relate to one another, and how they might systematically differ, is a crucial emerging area of research.
1.1.1 Teacher expectations
As a matter of course, teachers form expectations of their students. These expectations are not a priori good or bad, nor does it seem likely that they are eradicable. Issues arise, however, when teachers hold biased or otherwise discrepant expectations about students and these discrepant expectations contribute to educational inequities (e.g. Auwarter & Aruguete, 2008; McKown & Weinstein, 2002; Rist, 1970). Discrepant expectations refer to teacher over- or underestimates of a student’s ability on a given attribute when compared to another indicator of that same attribute (e.g. Harvey, Suizzo, & Jackson, 2016; Hinnant et al., 2009; Jussim et al., 1996). For example, if a teacher believes a student has relatively little aptitude for algebra but the student performs well on a standardized algebra assessment, this would indicate a discrepant expectation in the form of an underestimation of algebra ability. Discrepant expectations can be considered quantitative variables that have both a direction and a magnitude; that is, they can be either over- or underestimates and can represent different degrees of over- or underestimation (Madon et al., 1997). Below, we briefly review the research literature on discrepant teacher expectations related to student ability and motivation.
1.1.2 Expectations related to ability
Much of the research examining teacher expectations has focused on the relationship between teacher expectations of student ability and subsequent student academic performance across several content areas (e.g. Brophy, 1983; de Boer et al., 2010; Hinnant et al., 2009; Jussim et al. , 1996; Madon et al., 1997; Rosenthal & Jacobson, 1968). Such research often examines the “self-fulfilling prophecy” phenomenon in which teachers’ initial expectations of student academic ability influence later student academic performance by causing students to live up (or down) to the teacher’s expectations of them (Jussim & Harber, 2005). Generally, results from this line of research suggest that teacher expectations do predict later student performance, particularly for stigmatized or vulnerable students, although the magnitude and durability of these expectation effects over time remains unclear (de Boer et al., 2010; Hinnant et al., 2009; Jussim & Harber, 2005). Additionally, in an early meta-analysis of self-fulfilling prophecy studies, Brophy (1983) found that stronger expectation effects emerged when teacher expectations were manipulated early in a school year compared to when they were manipulated later. That is, when teachers’ expectations of students were influenced by unreliable or irrelevant information (e.g. race/ethnicity or invalid assumptions made by others) before these teachers had an opportunity to form realistic expectations of students based off more relevant information (e.g. classroom achievement), these discrepant expectations tended to have a larger effect on subsequent student performance.
Teachers seem to form expectations about students based on information beyond students’ previous academic performance. More specifically, previous research has found that student characteristics such as gender, ethnicity, and socioeconomic status (SES) all contribute to teacher expectations (e.g. Auwarter & Aruguete, 2008; Brophy, 1983; Jussim & Harber, 2005; McKown & Weinstein, 2002; Rist, 1970; Tenenbaum & Ruck, 2007). Research examining teacher expectations differing by student gender mostly suggests that teachers tend to hold higher expectations of female students in general (e.g. de Boer et al., 2010; Harvey et al., 2016; Hinnant et al., 2009); however, other studies have found that gender-based expectations may be contingent upon the content area in question. For example, McKown and Weinstein (2002) found negative expectation effects for female students in math but not in reading.
Findings from studies examining differences in teacher expectations by ethnicity predominantly indicate that teachers have higher expectations for White students than for stigmatized minority students (Jussim & Harber, 2005; Jussim et al., 1996; Tenenbaum & Ruck, 2007). In a series of meta-analyses on ethnicity and teacher expectations, Tenenbaum and Ruck (2007) found that teachers had higher academic expectations of White students than they did of African American students (d = .25) or Latinx students (d = .46), although they held slightly lower academic expectations of White students than they did of Asian American students (d = -.17). Additionally, findings suggested that teachers tended to speak more positively about (d = .31) and to (d = .21) White students than to African American and/or Latinx students. In contrast, a large-scale longitudinal study conducted by de Boer and colleagues (2010) found no expectation effects based on student ethnicity. However, this study was conducted in the Netherlands where the cultural climate may meaningfully differ from that of the United States.
Research also suggests that teachers tend to expect less of students from lower socio-economic status (SES) backgrounds than of students from more economically-advantaged backgrounds (Auwarter & Aruguete, 2008; Jussim, et al., 1996; Rist, 1970). In a landmark early study examining the relationship between teacher expectations and student SES, Rist (1970) observed a group of African American children throughout their kindergarten year and during portions of their first- and second-grade years. In short, Rist found that students from higher-SES backgrounds tended to align with the teacher’s idealized version of a successful student. The teacher, in turn, seemed to have higher expectations of students who matched her stereotype of how a successful student looked and behaved, and these differential expectations manifested themselves in how the teacher treated students as well as the opportunities the students were afforded in the classroom. More recent work further supports this notion that teachers often have higher expectations of students from high-SES backgrounds than they do of students from low-SES backgrounds (Jussim & Harber, 2005; Jussim et al., 1996), with some evidence suggesting that teachers may hold disproportionately low expectations for boys from more economically-disadvantaged backgrounds (Auwarter & Aruguete, 2008).
It is important to note that differences in teacher expectations by student gender, race, ethnicity, socioeconomic status, or other student characteristics are not necessarily indicative of bias, nor do they always produce self-fulfilling prophecies (Jussim & Harber, 2005). For teacher expectations to be biased, they must be systematically different about students based on certain student demographic characteristics (e.g. ethnicity) and they must be inaccurate (Madon et al., 1997). Previous research suggests that, even when teacher expectations for students differ according to student demographic characteristics, these expectations may accurately reflect real differences in student ability (Madon et al., 1998). In such circumstances, teacher expectations may be systematically different but unbiased.
1.1.3 Expectations related to other factors
Often, research investigating teacher expectations has focused on discrepancies between teacher perceptions of student ability and more objective measures of students’ capabilities (e.g. Brophy, 1983; Hinnant et al., 2009; McKown & Weinstein, 2002). For example, Hinnant and colleagues (2009) examined discrepancies in teachers’ perceptions of student academic ability and children’s scores on two subtests of the Woodcock Johnson Psycho-Educational Battery (Woodcock & Johnson, 1977). Some researchers have included measures of student motivation along with a standardized achievement score when estimating discrepancy in teacher expectations to control for additional student-level factors that might influence performance outcomes (e.g. de Boer et al., 2010; Madon et al., 1997). Further, other lines of research have focused on the discrepancy between teacher-perceived motivation and student-reported motivation (e.g. Harvey et al., 2016). For example, Harvey and colleagues (2016) used the residuals from a model in which teacher reported student self-efficacy was regressed on student reported self-efficacy to calculate a discrepancy score. They found that this discrepancy variable predicted students’ year-end grade in math and reading even after controlling for student ability using a standardized test score. This result suggests that teacher perceptions of student competencies other than academic ability may meaningfully relate to student outcomes.
Given these findings, it seems possible that teachers’ discrepant expectations of students in several areas may related to indicators of student academic performance. In the current study, we investigate the extent to which discrepancies in teachers’ perceptions of student writing self-regulatory behaviors relate to student writing/English Language Arts (ELA) grades. Although research resoundingly affirms that students’ self-regulation predicts numerous measures of academic success (e.g. Zimmerman, 2013), we are aware of no work that examines how discrepancies between teacher perceptions of student self-regulation and students’ perceptions of their own self-regulation might relate to student academic success.
1.1.4 Grades
In this study, we focus on the extent to which teachers’ perceptions of student writing self-regulatory behaviors predict students’ later writing/ELA grades. Therefore, we do not focus on whether students fulfill teachers’ expectations, but rather on how discrepant expectations of student self-regulatory behaviors might persist throughout the year and manifest themselves in students’ grades.
According to Brookhart and colleagues (2016), grades refer to “the symbols assigned to individual pieces of student work or composite measures of student performance on student report cards” (p. 804). However, the meaning of “performance” seems to vary quite a bit between teachers, and performance often represents more than standardized academic achievement or ability (Bowers, 2011; Brookhart et al., 2016; Casillas et al., 2012; McMillan, 2001; Willingham et al., 2002). Previous research on teachers’ grading practices has found that, although indicators of standardized achievement and prior grades tend to account for the largest amount of variance in teacher-assigned grades, factors such as student effort, motivation, improvement, and even behavior can also influence grading practices (e.g. Bowers, 2011; Casillas et al., 2012; McMillan, 2001). In a study of more than 4,000 students, Casillas and colleagues (2012) found that psychosocial and behavioral measures (e.g. motivation, self-regulation) were as useful for predicting high school GPA as were prior grades, although standardized achievement measures were the strongest predictors of GPA. This suggests that grades might provide a summary of cognitive and conative student characteristics (Brookhart et al., 2016).
Given that grades inform many high-stakes decisions made about students, such as decisions related to grade promotion, high school graduation, and college admission, it is critical that we understand which performances and competencies grades represent. Further, if grades are to serve as fair and valid indicators of student performance, we must not only understand the factors that contribute to grades but also how potential misperceptions of these factors relate to grades. Failure to address this second point could lead not only to inaccurate inferences about individual students based on their grades, but perhaps also systemic educational inequities depending upon possible patterns in these misperceptions.
1.1.5 Writing Self-Regulation
In academic contexts, self-regulation refers to a proactive process or set of processes that students employ either to learn or to produce an artifact demonstrating knowledge (Pintrich & De Groot, 1990; Winne & Hadwin, 1998; Zimmerman, 2008). These processes may include setting learning goals, using appropriate strategies, monitoring learning, and maintaining motivation throughout a learning task (Winne & Hadwin, 1998; Zimmerman, 2008). Although research suggests that promoting student self-regulation leads to increased achievement across several academic domains (Zimmerman, 2013), self-regulation may be particularly important in writing (Graham & Harris, 2000; Graham, Harris, & Mason, 2005, Graham & Perin, 2007; Santangelo, Harris, & Graham, 2016).
Writing is often a complex, prolonged process involving multiple recursive components, including planning, drafting, and revising. Given this, along with the difficulty of writing, it is no surprise that writing proficiently requires high levels of self-regulation (e.g. Graham, 2018; Graham & Harris, 2000; Hayes & Flower, 1980; Hayes & Flower, 1986; Zimmerman & Riesemberg, 1997). Indeed, several prominent models of writing emphasize many of the metacognitive processes implicated in effective self-regulation (Hacker, 2018; Hayes, 2012; Hayes & Flower, 1986). Engaging in self-regulatory behaviors, such as goal-setting and self-monitoring, may allow students to better navigate the complexities of a given writing task and may, in turn, positively influence writing-related beliefs (Graham & Harris, 2000). For example, multiple studies have demonstrated a positive relationship between student self-reported writing self-regulation and self-efficacy (Collie et al., 2016; Ekholm et al., 2015; Zimmerman & Bandura, 1994; Zumbrunn et al., 2016). Further, a large body of research overwhelmingly shows that teaching students writing self-regulatory strategies leads to considerable improvements in writing performance (Graham et al., 2005; Graham et al., 2015; Graham et al., 2012; Graham & Perin, 2007). Thus, self-regulation seems to play a critical role in the writing classroom.
Of particular relevance for this study is how teachers perceive students’ writing self-regulatory behaviors. As mentioned previously, research on grading practices indicates that teachers often take students’ self-regulatory behaviors into account when assigning grades (Brookhart et al., 2016). However, as is the case with perceptions of academic ability and self-efficacy, teachers may err in how accurately they perceive students’ self-regulatory behaviors. Although some writing self-regulatory behaviors are easy to observe, others may be more covert. For example, planning may be easily observed via a graphic organizer; however, strategies such as engaging in positive self-talk or monitoring progress toward goals may be harder for teachers to accurately infer. Given the difficulties inherent in observing some of these self-regulatory behaviors, it is possible that teachers unconsciously rely on (possibly irrelevant) student characteristics when making inferences about students’ self-regulation.
Thus, in this study, we are specifically interested in the extent to which teachers’ assessments of students’ self-regulation align with students’ own assessments, and further, the extent to which the discrepancy in those assessments might also be predictive of writing outcomes. If discrepancy measures, such as the one we explore here, are predictive of writing outcomes above and beyond typical measures of self-regulation, we believe that this measure can have real value for researchers and practitioners.
1.1.6 The present study
In the present study, we investigated discrepancies between teacher and student ratings of student writing self-regulation. To extend the literature on teacher expectations, we were interested in the relations between these discrepant expectations and student demographic characteristics, end-of-year writing/ELA grades, and student writing achievement. The following research questions guided the study:
1.Does the average discrepancy between teacher and student perceptions of writing self-regulation differ according to student demographics, including gender, race/ethnicity, and socioeconomic status?
2. To what extent do discrepant teacher expectations of student writing self-regulation uniquely predict student grades after accounting for prior writing achievement and student demographic variables?
3. Does the relationship between discrepant expectations and writing grades differ across different student demographic groups?
All participants in the study were part of a three-year longitudinal study in a large, suburban school district in Virginia. To qualify for inclusion in the current study, participants from the longitudinal study must have had a score on a standardized statewide writing test, which at time this study was conducted were administered to students in 5th, 8th, and 10th grade. This resulted in the inclusion of 201 students for whom we had a test score from either the 5th, 8th, or 10th grade test, as well as both teacher and student ratings of writing self-regulation and an end-of-year writing grade. Both student and teacher self-regulation ratings were required to calculate our measure of discrepancy described below. The sample consisted of 91 females (45%) and 110 males (45%), with 83 (41%) students identifying as African American, 73 (36%) identifying as White, 35 (17%) identifying as Latinx, and 10 (5%) identifying as another ethnicity or multiracial. Additionally, 8 (4%) of these students received special education services, 1 (.50%) was classified as an English Language Learner (ELL), 15 (7%) were classified as gifted, and 59 (29%) were classified as economically disadvantaged.
2.2.1 State standardized writing test
The Virginia Standards of Learning (SOL) standardized writing test was administered each spring to students in 5th, 8th, and 10th grade.1 Each test is intended to assess the state’s writing standards not only for the grade level in which the test is given but also for all grades between the current test year and the previous writing test. For example, the 8th grade test assesses writing standards for 6th, 7th, and 8th grades. Although the exact standards assessed on the tests differ according to the grade in which they are given, all writing standards are subsumed under two broad categories: 1) “research, plan, compose, and revise for a variety of purposes” and 2) “edit for correct use of language, capitalization, punctuation, and spelling.” Each test consists of two subtests: a multiple-choice/technology enhanced item (MC/TEI) subtest and an open-ended constructed response (e.g. personal narrative, persuasive essay) subtest. Scores from each subtest contribute equally to the student’s overall score, and these total scores can range from 0 to 600. The lower threshold for a “proficient” score (i.e. a passing score) is 400, and the lower threshold for an “advanced” score is 500. According to the 2014-2015 Virginia Standards of Learning Technical Report (Virginia Department of Education, 2015), scores on the writing tests demonstrated good reliability for all combinations of MC/TEI tests and writing prompts (stratified alpha range .84 - .88).
There was one circumstance in which participants might have multiple test scores. Because the longitudinal study from which these participants were recruited took place over 3 years, there is a cohort of students for whom we had both an 8th and a 10th grade test score (i.e. students who were in 8th grade during the first year of data collection and 10th grade during the third year of data collection). We chose to use the 8th grade test scores for this group because there was less missing data on other measures at this measurement point than at the 10th grade measurement point.
2.2.2 Student writing/English language arts grades
In this study, grades represent a student’s end-of-year grade in writing/English Language Arts. For students in elementary school, writing grades comprised the several standards-based criteria: writes for a variety of purposes; edits writing for correct grammar, capitalization, punctuation, and spelling; and demonstrates growth in word study knowledge. For students in high school, ELA grades included teachers’ judgments of students’ progress on state standards related to both reading and writing. Across all grade levels, grades were reported by the school division in a letter-grade format (e.g. A, B, C), including both pluses and minuses. After examining the distribution of all grade categories, and recognizing that including all letter grades with pluses and minuses would result in a highly uneven and unbalanced grade distribution, we instead collapsed grades into three distinct categories: 1 = C, D, or F, 2 = B, and 3 = A. This categorization roughly divides the sample into thirds as demonstrated by the grade category barplot found in Figure 1.
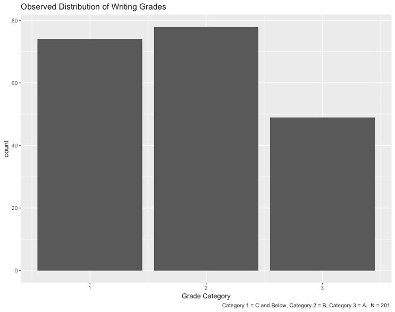
Figure 1. Distribution of writing grades.
Balancing model complexity was also a consideration, since any schema beyond two categories would require an ordinal or multinomial logistic regression and adding many more categories would further complicate the interpretation of our models. After examining the observed distribution of grades and weighing the additional complexity of modeling additional categories, we arrived at a three-category construct.
2.2.3 Student-reported writing self-regulation measure
To measure students’ assessment of their self-regulation, we used eight items from the larger Writing Self-Regulation Aptitude Scale (WSRAS; Ekholm et al., 2015), which was originally intended for use with college students. The scale asks students to rate their perceived writing self-regulative behaviors on a scale from 1 (Almost never) to 4 (Almost always), and it assesses the self-regulated learning processes of goal setting, planning, self-monitoring, attention control, emotion regulation, self-instruction, and help-seeking for writing. For the current study, the items, “I make my writing better by changing parts of it” and “I tell myself I did a good job when I write my best,” were added to include the self-regulation processes of self-evaluation and self-imposed contingencies. Additionally, slight changes in language were made to the original items to ensure the developmental appropriateness of the scale. All items for this scale are available in Appendix A. McDonald’s omega (McDonald, 1970; McNeish, 2017) for scores on this measure was .78.
2.2.4 Teacher-reported student writing self-regulation measure
The Teacher-Reported Student Writing Self-Regulation Measure (TRSWSR; Zumbrunn, 2014) is a three-item scale that asks teachers to assess the frequency with which their students plan their writing, revise their writing, and persist through difficulties during writing. All items are measured on a scale of 1 (Never) to 10 (Always). McDonald’s omega (McDonald, 1970; McNeish, 2017) for scores on this measure was .88. Since teachers were asked to assess the self-regulation of several students in their classes, we opted to make this scale considerably shorter than the student-report self-regulation measure to avoid overburdening teachers. Both the student- and teacher-report writing self-regulation measures were collected in the fall of the school year.
2.2.5 Student demographics
Several demographic predictors were included as covariates in this study, including gender, socioeconomic status, and race/ethnicity. All data for these measures was provided by the participating school division, and the operationalization of each is consistent with division- and state-level practices. Gender was operationalized here as male vs. female. Socioeconomic status was defined as whether a student was classified by the Virginia Department of Education as economically disadvantaged.2 Students’ race/ethnicity was operationalized into five groups: White, African American, Asian, Latinx, or Multiracial. Any student who identified as having Hispanic or Latino ethnicity (regardless of racial identification) was classified as Latinx. Due to small sample limitations, demographics such as ELL status, gifted status, and special education identification were not included in these analyses.
2.3.1 Estimating discrepancy scores
We modify a procedure common in the teacher expectation literature to estimate discrepancies in teacher expectations (e.g. Harvey et al., 2016; Hinnant et al., 2009). First, we estimated confirmatory factor analysis (CFA) models for teacher- and student-reported self-regulation and then obtained predicted values of the standardized latent teacher- and student-report variables for each student. Then, we subtracted the value of the student-report latent score from the teacher-report latent score to obtain our estimate of teacher discrepancy. Our approach differs slightly from Harvey et al. (2016), who estimated discrepancy scores using the residuals of a linear model with student self-regulation predicting teacher self-regulation. By using latent variables to represent our discrepancy scores, we obtained scores that had less measurement error compared to using observed measures alone (Kline, 2016).
The discrepancy variable represents the difference between a student’s self-rating of self-regulation and the teacher’s evaluation of the student’s self-regulation after accounting for measurement error. Negative values of the discrepancy variable represent cases where teacher ratings are lower than student ratings (i.e. underestimations), whereas positive discrepancy values represent cases where teacher ratings are higher than student ratings (i.e. overestimations).
2.3.2 Group comparisons
To determine the extent to which teacher discrepancy scores differ by group, we use independent samples t-tests for comparisons by gender and SES, and a one-way ANOVA for comparisons by race/ethnicity.
2.3.3 Multilevel modeling
Because the students in this study were nested within classrooms, we performed multilevel analyses using a two-level generalized linear mixed model with a multinomial distribution and a generalized logistic link function (Agresti, 2012). This is the multilevel complement to the single-level multinomial logistic regression (Cohen et al., 2003; Long & Freese, 2014). Given the ordinal nature of our outcome measure (course grades), we arrived at the generalized multinomial logit after testing the adequacy of an ordinal logistic regression. Our initial model failed the Brant Wald test for proportional odds (p = .004) (Brant, 1990), which suggested that a multinomial distribution better characterized the pattern of responses than an ordinal logistic regression. To obtain model estimates, one outcome category (grade of A) was used as the reference category, and simultaneous models were fit comparing log odds of a student earning a (grade of B) or (grade of C and below) relative to a (grade of A).
The overall modeling approach included six steps. In Step 1, writing SOL scores, a measure of prior performance, was included. Our predictor of interest, student-teacher discrepancy score, was included in Step 2. In Step 3, students’ self-regulation score was introduced. In Step 4, a vector of student demographic covariates was introduced, including district-reported measures of race, ethnicity, gender, and whether a student qualifies as economically disadvantaged. Step 5 tested race/ethnicity, gender, and economic disadvantaged status as moderators of student/teacher discrepancy using interaction effects. Finally, in Step 6, a between-classroom (teacher level) covariate, average discrepancy, was introduced in addition to the variables included in Steps 1-5. This model building approach, sequentially adding level one predictors, followed by level 2 predictors, is recommended by Hox (2010) and allows for a more thorough examination of how student- and teacher-level predictors function in relationship to the outcome. It also facilitates a richer understanding of the extent to which blocks of covariates explain additional residual variance at the within- or between-person level.
By simultaneously fitting student- and teacher-level equations, multilevel modeling can more accurately partition between- and within-classroom variance. Given the relatively small number of clusters (teachers) in this study (n = 18), we chose to limit our model to include only a random intercept; all slopes were treated as fixed. This choice is justified given the significant power demands and increasing complexity of estimation that occur with each additional random effect. All multilevel analyses were conducted using Mplus 8.0 (Muthén & Muthén, 1998 - 2017).
2.3.4 Testing model robustness using fixed effects
To test the robustness of our model to unexplained heterogeneity at the teacher level, we also used a fixed effects regression model with a multinomial logistic link (Allison, 2009; Wooldridge, 2016), clustering by teacher, which applies a fixed effects transformation to all within-teacher predictors. This approach effectively removes all between-teacher heterogeneity, which is important given that unobserved or unexplained teacher characteristics may confound our interpretation of the relationship between teacher discrepancy score and grades. Thus, if results are consistent between our preferred MLM model and the more restrictive fixed effects model, we may assume that there are no significant teacher-level confounding variables that we have missed. We also used a regular multinomial logit model (without random effects) along with cluster-robust standard errors. This is an additional approach for handling clustered data, and while not as preferred3 as our approach and fixed effects, it provides an additional useful comparison point for the robustness of our model to our specifications.
2.3.5 Missing data
All cases included in this study were complete, therefore, this study did not have any missing data. Our design, which relied on the calculation of a teacher discrepancy score that required an observed student and teacher score for self-regulation, necessitated the exclusion of non-complete cases.
We began our analysis by conducting a confirmatory factor analysis with our latent measures of student- and teacher-reported self-regulation. This model demonstrated acceptable to good model fit according to the criteria recommended by Hu and Bentler (1999) (CFI = .95, RMSEA = .069, 90% CI [.047, .091]). Having confirmed that our model accurately represents the underlying covariance in our data, we then subtracted the predictions (TSR – SSR) from our CFA model to create our teacher discrepancy score. A histogram of this new variable is found in Figure 1. Given the formula used to calculate it, students with a negative discrepancy score are those whose self-rating was higher than that of their teacher (resulting in a negative score). Similarly, students with a positive discrepancy are those whose self-rating was lower than that of their teacher (resulting in a positive score). Students with discrepancy values at or near zero are those whose self-rating was equivalent to that of their teacher.
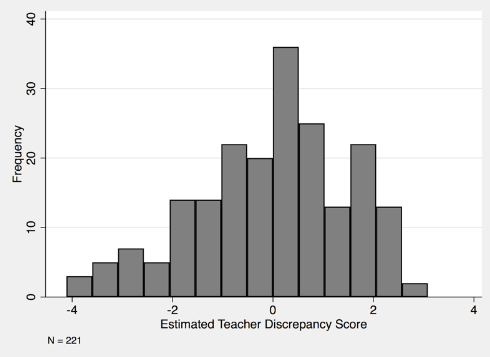
Figure 2. Distribution of student-teacher discrepancy.
Using our model-predicted estimate of teacher discrepancy, we first conducted a series of mean comparisons to investigate whether this construct differs according to common student demographics. Using independent-samples t-tests, we compared students according to gender (males vs. females), and socioeconomic status (students classified as economically disadvantaged vs. those not classified). Results indicated that females had a significantly more positive teacher discrepancy than males (t = 3.67, df = 199, p <.001). This suggests that compared to students’ self-evaluations, teachers tend to overestimate females’ self-regulation and under-estimate males’ self-regulation in their writing. No significant differences were found by economically disadvantaged status (p = .54). We also used a one-way analysis of variance (ANOVA) to examine whether, on average, teacher discrepancy ratings differed according to students’ identified race/ethnicity. The overall model was not significant (F(4, 196) = 1.28, p = .28), which suggests that average discrepancy scores do not differ significantly by student race/ethnic group.
Next, we estimated a set of zero-order correlations to assess the interrelationships between our measured scales, grades, and standardized writing score. Results can be found in Table 1. Several significant correlations emerged, including a positive and correlation between SOL score and final grades (r = .58, p < .001). Teacher discrepancy was positively correlated with SOL score (r = .39, p < .001) and end-of-year grade (r = .50, p < .001). Student-reported self-regulation was not significantly correlated with either SOL score (r = .04, p = .69) or end of year grade (r = .11, p = .33).
Table 1
Pairwise Correlations Among Variables of Interest
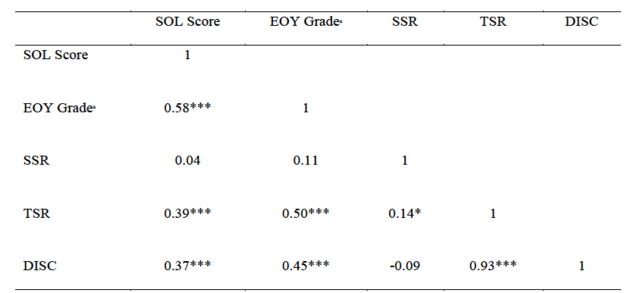
Notes. SOL = Virginia Standards of Learning Exam. EOY =
End of Year. SSR = Student-Reported Self-Regulation. TSR =
Teacher-Reported Self-Regulation. DISC = Discrepancy between TSR
and SSR. a All correlations with EOY Grade, an ordinal variable,
are Spearman rank-order correlations. * p < .05. *** p <
.001.
Next, we estimated a series of multilevel models with students modeled at Level 1, nested within teachers at Level 2, and final grades as the outcome. Covariates in our final model include SOL scores, discrepancy scores, student self-regulation, and the student demographics described above. Descriptive statistics for this model can be found in Table 2.
Table 2
Descriptive Statistics for Variables of Interest
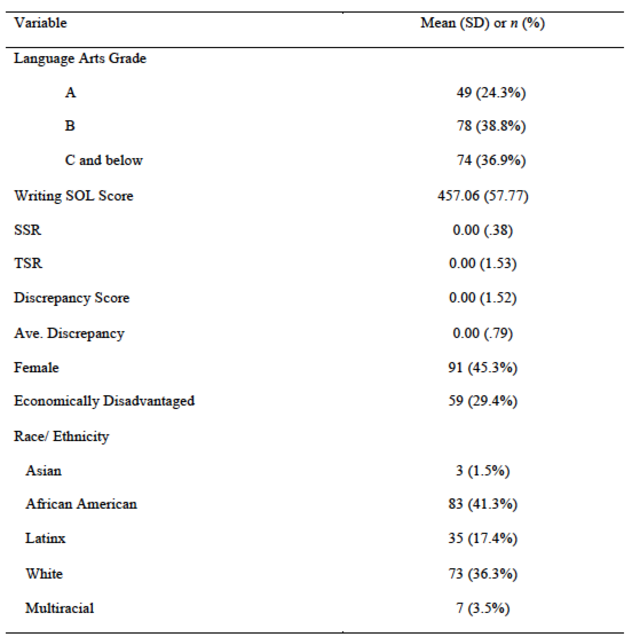
Notes. N = 201. Data are presented as mean (SD) for
continuous measures, and n (%) for categorical measures.
We used a hierarchical model building approach and arrived out our final model in six steps. For the sake of parsimony, we only interpret the final main effect model results here, however, full estimates of all models are available in Table A1 in the Appendix. Results are presented in two blocks – first, we interpret the coefficients that compare the odds of earning an A vs. a B. Second, we interpret the coefficients that compare the odds of earning an A vs. a C or below. A visual summary of all coefficients can be found in Figure 3.
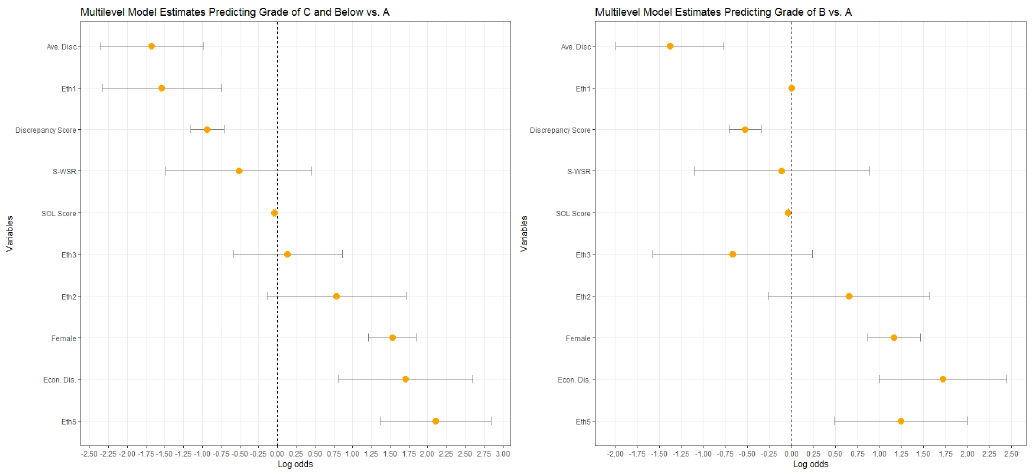
Figure 3. Visual summary of multilevel model estimates.
3.4.1 Comparing the odds of earning A vs. B
Higher SOL scores were significantly associated with lower odds of earning a B vs. earning an A (b = -0.04, p < .001). In standardized units, for each one-SD increase in SOL score, the odds of earning a B (vs. an A) decreased by about 45 percent. Teacher discrepancy score was significant and associated with lower odds of earning a B (b = -.53, p < .001). For each one-SD increase in teacher discrepancy (suggesting that teachers overrate students’ self-regulation relative to their self-assessment), the odds of earning a B (vs. an A) decrease by about 21 percent. Student-reported self-regulation was not found to be a significant predictor of grades when controlling for SOL score and teacher discrepancy score (b = -.11, p =.91).
Along with the three predictors of interest interpreted above, a vector of student demographics, including gender, race/ethnicity, and economically disadvantaged status were included in the final model. Females were predicted to have 221 percent higher odds of earning a B vs. an A compared to males (b = 1.17, p < .001), and economically disadvantaged students were predicted to have 458 percent higher odds of earning a B vs. an A compared to non-economically disadvantaged students (b = 1.72, p < .018) after controlling for SOL score, teacher discrepancy, and student self-report . In Step 5, we introduced a series of discrepancy-by-demographic interaction effects to test for statistical moderation. We found that none of our demographic variables moderated the relationship between discrepancy score and grades.
Finally, we also introduced a teacher-level covariate, average discrepancy score, to examine whether a given teacher’s tendency to over- or under-rate self-regulation relative to their students was associated with differential odds of earning a B vs. an A. We found that it was (b = -1.38, p =.028), which suggests that for each one-unit increase in a teacher’s average discrepancy, we would expect the odds of earning a B vs. an A to decrease by about 75 percent.
3.4.2 Comparing the odds of earning A vs. C or below
As might be expected, nearly all predictors had coefficient estimates of similar magnitudes and directions when comparing the odds of earning a C or below vs. an A. Increases in SOL scores (b = -0.04, p <.001) and teacher discrepancy scores (b = -0.94, p <.001) were both significant and associated with decreased odds of earning a C or below vs. an A. Thus, increases in these measures would predict higher odds of receiving an A. The estimates for a teachers’ average discrepancy at the classroom level functioned similarly and were significant (b = -1.67, p <.001), which suggested again that as a teachers’ average tendency to overrate their students’ self-regulatory behaviors increased, they were also more likely to assign a given student a high grade. Finally, gender appeared to function similarly for this outcome category, as females had significantly higher odds of earning a C or below vs. an A compared to males with similar SOL scores and teacher discrepancy scores (b = 1.53, p <.001).
Several predictors did not function equivalently when comparing the odds of earning an A vs. a C or below, and this is likely why the model overall did not satisfy the proportional odds assumption required to use ordinal (vs. multinomial) logistic regression. Economic disadvantage was not found to be a statistically significant predictor, although the magnitude and direction were similar to the B vs. A estimates. Additionally, students who identified as multiracial were found to have significantly higher odds of earning a C or below vs. an A compared to white students (b = 2.11, p = .004), although given the especially small subsample of multiracial students in this study, we would advise caution in over-interpreting the significance of this result.
To test the robustness of our model to unexplained or confounding variables at the teacher level, we also employed a fixed-effects panel regression model, which uses a fixed-effects transformation to eliminate all teacher-level heterogeneity, and a regular multinomial regression model with cluster-robust standard errors. These represent alternative approaches to operationalizing the model we tested, and as such, we would expect the coefficient estimates derived from all three to be quite similar. To test this assumption, we repeated our analysis two more times and compared the results. The covariates used (except for average discrepancy, which could not be included in the fixed effects model) and the modeling process proceeded as with the multilevel formulation. Results were generally very consistent, with discrepancy remaining a significant and positive predictor of student grades, although the magnitude of the discrepancy coefficient was slightly larger in our preferred MLM approach. A comparison of the estimates for the discrepancy measure can be found in Table 3.
Table 3
Sensitivity Analysis of Discrepancy Estimates Comparing MLM, RE, and OLR-CR Models

Notes. MLM = Multilevel model. RE = Random effects
ordinal logit model. OLR-CR = Ordinary logistic regression model
with cluster (teacher)-robust standard errors. All estimates are
presented as log odds coefficients. *** p< .001.
The purpose of this study was to examine the relations between students’ reports of their own writing self-regulation, teacher reports of student writing self-regulation, standardized writing achievement, student writing/English Language Arts (ELA) grades, and student demographics. More specifically, we were interested in better understanding discrepancies between student and teacher reports of self-regulation, including how these discrepancies might relate to writing outcomes as well as how they might manifest differently among student demographic groups. When comparing discrepancy scores across student demographic characteristics, we found that females had significantly higher discrepancy scores than males, indicating that, relative to students’ self-ratings, teachers tend to overestimate females’ writing self-regulation and underestimate males’ writing self-regulation. Using multilevel modeling, nesting students within classrooms, we found that the discrepancy between teachers’ beginning of the year evaluation of students’ self-regulation and students’ own evaluation of their self-regulation is a significant and positive predictor of students’ final grades in writing/ELA. Further, we found that this discrepancy remains predictive of grades even after accounting for a range of covariates, including students’ demographic background and prior achievement in writing, suggesting that this discrepancy is a durable construct that is not subsumed by other common predictors of academic performance.
As prior research has shown (Brookhart et al., 2016; Casillas et al., 2012; Willingham et al., 2002), grades represent an amalgamation of several factors, including student ability, knowledge, motivation, persistence, and behavior. Across this body of research, student ability regularly emerges as the strongest single predictor of grades. Unsurprisingly, this was the case in this study as well. Students’ end-of-year writing/ELA grades were more highly correlated with standardized writing achievement scores than with any other predictors examined in the current study. Similarly, in our final regression model, standardized writing achievement made the strongest unique contribution to the prediction of students’ grades. Nevertheless, our discrepancy score variable was correlated with students’ final grades (r = .50) and uniquely predicted students’ grades after accounting for the influence of other predictors, including writing achievement. This finding echoes that of previous research (e.g. Harvey et al., 2016) indicating that teachers’ perceptions of students’ behavioral and psychological characteristics meaningfully relate to grading decisions, even after these perceptions have been adjusted to account for similar information from other sources.
We also found that female students tend to have larger positive discrepancy scores than male students. There are two possible explanations for this. First, female students may be more critical of their self-regulation in writing. If female students tend to underestimate their own self-regulation, then even accurate teacher estimations would yield positive discrepancy scores because of how these scores were calculated. Inversely, teachers may overestimate female students’ self-regulation in relation to their male peers. This explanation is consistent with prior research investigating gender-based motivational differences across academic domains (e.g. Meece et al., 2006; Pajares et al., 1999). According to this body of research, females are, on average, more motivated in ELA disciplines than are their male counterparts. If teachers are familiar with this trend or otherwise hold high a priori expectations of female writers, they may overestimate female students’ writing self-regulation. However, it should be noted that these findings conflict somewhat with results reported by McKown & Weinstein (2002), who found no teacher expectation effects for females in the domain of reading.
Contrary to the results of several previous studies suggesting teachers hold differential expectations of students based on their ethnicity and/or socioeconomic status (Auwarter & Aruguete, 2008; Rist, 1970; Tenenbaum & Ruck, 2007), we did not find any significant differences in self-regulation discrepancy scores between these groups. Further, these demographic variables did not significantly predict student grades. One possible explanation for this has to do with when we administered our fall survey. The school district in which this study was conducted begins its academic year immediately following Labor Day, and teachers rated students’ writing self-regulation in October. According to Brophy (1983), teachers may rely more heavily on student demographic characteristics to inform expectations very early in the school year, when they do not yet have more relevant information about these students. Given that the teachers in this study had several weeks to form expectations of their students from these students’ writing behaviors, it seems possible that they based these expectations more on their observations of students’ writing proficiencies than on student ethnicity.
This study has a number of important limitations worth highlighting. First, all participating students and teachers were recruited from a single school division, albeit a demographically diverse one. Therefore, it is possible that factors unique to this district, such as district-level policies relating to grading practices, could influence the results we report here. Second, although our modeling strategy accounts for some between-teacher differences in discrepancy scores and grading practices, previous research suggests that teachers vary in the factors they consider when assigning student grades (e.g. McMillan, 2001). We did not have enough teachers to investigate many teacher-level variables relating to student grades, so we could not investigate typical grading practices as a predictor. This is a potential area for future research. Third, the grades variable we examine here refers to the students’ grade in writing/English Language Arts. Therefore, this grade likely reflects factors such as reading ability, behaviors, and motivation in addition to writing ability, behaviors, and motivation. Although reading and writing scores are typically highly correlated (Stotsky, 1983), they are nevertheless different domains.
Most importantly, our work here operationalizes writing self-regulation in a very specific (and perhaps narrow) way, focusing on the extent to which students plan, revise, and persist in writing despite challenges. We recognize that these three behaviors represent only a thin slice of the larger set of behaviors that encompass writing self-regulation. Future research should seek to explore associations involving other key components of self-regulation, and should explore (perhaps qualitatively) how teachers themselves conceptualize writing self-regulation to ensure that important behaviors are not being overlooked. In addition, future work should consider the relationship between self-regulation discrepancy and other measures of writing performance and achievement, especially measures such as standardized writing prompts that can be independently scored and evaluated and do not involve as much subjective input from teachers. This would help to further establish the validity of self-regulation discrepancy as a concept distinct from teacher- or student- evaluated self-regulation in isolation, especially given the strong pairwise correlations that we observed in this study between discrepancy, teacher-reported self-regulation, and writing grades.
The results of this study raise several important questions. Most notably, this work demonstrates that teachers’ initial perceptions of student writing self-regulation are predictive of students’ eventual performance in language arts class. This finding alone may not raise eyebrows- after all, students who demonstrate higher levels of self-regulation early on are also more likely to end up with higher grades in class. This study, however, goes a step further. We find that the discrepancy between teacher and student perceptions remain predictive of performance, even after controlling for students’ prior performance and their own evaluation of their self-regulation. In other words, when teachers tend to overestimate a student’s self-regulation, that student is more likely to end up with higher grades, even after controlling for the student’s demonstrated ability or own perceptions of self-regulation.
This finding is particularly interesting in the context of writing, where many (but certainly not all) measures of writing self-regulation (e.g. planning, revising, avoiding distractions) are usually behaviors that can be easily observed by teachers in situ. The writing self-regulation scale used here focuses largely on the use of writing strategies and processes, such as planning and revising, and on writing persistence, such as writing for longer periods of time while remaining focused. However, the observability of these behaviors does not seem to mitigate the discrepancies that can emerge between student and teacher reports, and further, these discrepancies remain a positive and significant predictor of writing achievement after accounting for other measures of writing ability.
Given these findings, what new questions arise for writing researchers? A key question seems to be if writing self-regulation discrepancy exists, and is not explained by typical background characteristics, what is driving it? How do teachers come to over-estimate (or students under-estimate) writing self-regulation? And how does this systematic discrepancy in turn lead to differential performance grades in writing, even after accounting for prior student academic performance? One possible avenue of exploration might be mixed-methods research that systematically identifies students with low and high discrepancy scores, and then uses interviews, focus groups, or field observation to obtain more nuanced understandings of the classroom and individual processes at play. This type of work would further unpack the complex associations revealed in this study.
So where does this leave writing teachers? The task of accurately assessing developing writers is a challenging one, and surely it involves careful observation of how students are implementing new writing strategies. However, the results may suggest some caution to those who might view these behaviors as a relatively “clean” measure of writing achievement. Even when observing these processes, subtle biases can emerge that can shape teachers’ future assessment and evaluation of their students.
This research was supported by grants from the Virginia Commonwealth University Presidential Research Incentive Program and the Virginia Commonwealth University Foundation Langschultz Fund. The views expressed in this paper are those of the authors and do not necessarily reflect the views of the granting agencies or organizations.
1 Since then, Virginia has eliminated the 5th grade writing test. The 8th and 10th grade tests remain in use.
2 The Virginia Department of Education assigns “economically disadvantaged” status each year for students who: 1) are eligible for Free/Reduced Price Meals, 2) receive Temporary Aid for Needy Families (TANF), or 3) are eligible for Medicaid.
3 We found that adjusting standard errors for clustering was less preferred than either a fixed effects or multilevel approach because it only impacts the size of the estimated standard errors, and not the magnitude of the coefficients. The other two methods we tested can adjust both standard errors and coefficient estimates for clustering.
Agresti, A. (2012). Categorical data analysis (3rd Ed.).
New York, NY: John Wiley & Sons.
Allison, P. D. (2009). Fixed effects regression models.
Thousand Oaks, CA: SAGE.
Auwarter, A. E., & Aruguete, M. S. (2008). Effects of student
gender and socioeconomic status on teacher perceptions. The
Journal of Educational Research, 101(4), 242-246.
https://doi.org/
10.3200/JOER.101.4.243-246
Brant, R. (1990). Assessing proportionality in the proportional
odds model for ordinal logistic regression. Biometrics, 46,
1171–1178. https://doi.org/10.2307/2532457
Brookhart, S. M., Guskey, T. R., Bowers, A. J., McMillan, J. H.
Smith, J.K., Smith, L. F., … & Welsh, M. E. (2016). A century
of grading research: Meaning and value in the most common
educational measure. Review of Educational Research, 86(4),
803-848. https://doi.org/10.3102%2F0034654316672069
Brophy, J. E. (1983). Research on the self-fulfilling prophecy and
teacher expectations. Journal of Educational Psychology,
75(5), 631-661.
https://doi.org/10.1037/0022-0663.75.5.631
Bowers, A. J. (2011). What’s in a grade? The multidimensional
nature of what teacher-assigned grades assess in high school. Educational
Research and Evaluation, 17(3), 141-159.
https://doi.org/10.1080/13803611.2011.597112
Casillas, A., Robbins, S., Allen, J., Kuo, Y. L., Hanson, M. A.,
& Schmeiser, C. (2012). Predicting early academic failure in
high school from prior academic achievement, psychosocial
characteristics, and behavior. Journal of Educational
Psychology, 104(2), 407-420.
https://doi.org/10.1037/a0027180
Cohen, J., Cohen, P., West, S. G., & Aiken, L. S. (2003).
Applied multiple regression/correlation analysis for the
behavioral sciences (3rd ed.). Lawrence Erlbaum
Associates.
Collie, R. J., Martin, A. J., & Curwood, J. S. (2016).
Multidimensional motivation and engagement for writing: Construct
validation with a sample of boys. Educational Psychology, 36(4),
771-791. https://doi.org/10.1080/01443410.2015.1093607
de Boer, H., Bosker, R. J., & van der Werf, M. P. (2010).
Sustainability of teacher expectation bias effects on long-term
student performance. Journal of Educational Psychology, 102(1),
168-179. https://doi.org/10.1037/a0017289
Duckworth, A. L., & Yeager, D. S. (2015). Measurement matters:
Assessing personal qualities other than cognitive ability for
educational purposes. Educational Researcher, 44(4),
237–251. https://doi.org/10.3102/0013189X15584327
Ekholm, E., Zumbrunn, S., & Conklin, S. (2015). The relation
of college student self-efficacy toward writing and writing
self-regulation aptitude: Writing feedback perceptions as a
mediating variable. Teaching in Higher Education, 20(2),
197-207. https://doi.org/10.1080/13562517.2014.974026
Graham, S. (2018). A writer(s) within community model of writing.
In C. Bazerman, V. Berninger, D. Brandt, S. Graham, J. Langer, S.
Murphy, P. Matsuda, D. Rowe, & M. Schleppegrell, (Eds.), The
lifespan development of writing (pp. 271-325). National
Council of English.
Graham, S., & R. Harris, K. (2000). The role of
self-regulation and transcription skills in writing and writing
development . Educational Psychologist, 35(1), 3-12.
https://doi.org/10.1207/S15326985EP3501_2
Graham, S., Harris, K. R., & Mason, L. (2005). Improving the
writing performance, knowledge, and self-efficacy of struggling
young writers: The effects of self-regulated strategy development.
Contemporary Educational Psychology, 30(2), 207-241.
https://doi.org/10.1016/j.cedpsych.2004.08.001
Graham, S., Harris, K. R., & Santangelo, T. (2015).
Research-based writing practices and the Common Core:
Meta-analysis and meta-synthesis. The Elementary School
Journal, 115(4), 498-522. https://doi.org/10.1086/681964
Graham, S., McKeown, D., Kiuhara, S., & Harris, K. R. (2012).
A meta-analysis of writing instruction for students in the
elementary grades. Journal of Educational Psychology, 104(4),
879-896. https://doi.org/10.1037/a0029185
Graham, S., & Perin, D. (2007). A meta-analysis of writing
instruction for adolescent students. Journal of Educational
Psychology, 99(3), 445-476.
https://doi.org/10.1037/0022-0663.99.3.445
Hacker, D. (2018). A metacognitive model of writing: An update
from a developmental perspective. Educational Psychologist,
53 (4), 220-237.
https://doi.org/10.1080/00461520.2018.1480373
Harvey, K. E., Suizzo, M. A., & Jackson, K. M. (2016).
Predicting the grades of low-income–ethnic-minority students from
teacher-student discrepancies in reported motivation. The
Journal of Experimental Education, 84(3),
510-528. https://doi.org/10.1080/00220973.2015.1054332
Hayes, J. R. (2012). Modeling and remodeling writing. Written
Communication, 29(3), 369-388.
https://doi.org/10.1177/0741088312451260
Hayes, J. R., & Flower, L. S. (1980). Identifying the
organization of writing processes. In L. Gregg & E. Steinberg
(Eds.), Cognitive processes in writing (pp. 3 –30).
Lawrence Erlbaum Associates, Inc.
Hayes, J. R., & Flower, L. S. (1986). Writing research and the
writer. American Psychologist, 41(10),
1106-1113. https://doi.org/10.1037/0003-066X.41.10.1106
Hinnant, J. B., O’Brien, M., & Ghazarian, S. R. (2009). The
longitudinal relations of teacher expectations to achievement in
the early school years. Journal of Educational Psychology,
101(3), 662–670. https://doi.org/10.1037/a0014306
Hox, J. J. (2010). Multilevel analysis: Techniques and
applications (2nd ed.). Routledge.
Hu, L. T., & Bentler, P. M. (1999). Cutoff criteria for fit
indexes in covariance structure analysis: Conventional criteria
versus new alternatives. Structural Equation Modeling: A
Multidisciplinary Journal, 6(1), 1-55.
https://doi.org/10.1080/10705519909540118
Jussim, L., Eccles, J., & Madon, S. (1996). Social perception,
social stereotypes, and teacher expectations: Accuracy and the
quest for the powerful self-fulfilling prophecy. In Advances
in experimental social psychology (Vol. 28, pp. 281-388).
Academic Press.
Jussim, L., & Harber, K. D. (2005). Teacher expectations and
self-fulfilling prophecies: Knowns and unknowns, resolved and
unresolved controversies. Personality and Social Psychology
Review, 9(2), 131-155.
https://doi.org/10.1207/s15327957pspr0902_3
Kline, R. (2016). Principles and practice of structural
equation modeling (4th ed.) Guilford Press.
Long, J. & Freese, J. (2014). Regression models for
categorical dependent variables using Stata (3rd ed.).
Stata Press.
Madon, S., Jussim, L., & Eccles, J. (1997). In search of the
powerful self-fulfilling prophecy. Journal of Personality and
Social Psychology, 72(4), 791-809.
https://doi.org/10.1037/0022-3514.72.4.791
Madon, S., Jussim, L., Keiper, S., Eccles, J., Smith, A., &
Palumbo, P. (1998). The accuracy and power of sex, social class,
and ethnic stereotypes: A naturalistic study in person perception.
Personality and Social Psychology Bulletin, 24(12),
1304-1318. https://doi.org/10.1177/01461672982412005
McDonald, R. P. (1970). The theoretical foundations of principal
factor analysis, canonical factor analysis, and alpha factor
analysis. British Journal of Mathematical and Statistical
Psychology, 23(1), 1-21.
https://doi.org/10.1111/j.2044-8317.1970.tb00432.x
McKown, C., & Weinstein, R. S. (2002). Modeling the role of
child ethnicity and gender in children's differential response to
teacher expectations. Journal of Applied Social Psychology,
32 (1), 159-184.
https://doi.org/10.1111/j.1559-1816.2002.tb01425.x
McMillan, J. H. (2001). Secondary teachers' classroom assessment
and grading practices. Educational Measurement: Issues and
Practice, 20(1), 20-32.
https://doi.org/10.1111/j.1745-3992.2001.tb00055.x
McNeish, D. (2018). Thanks coefficient alpha, we’ll take it from
here. Psychological Methods, 23(3), 412-433.
https://doi.org/10.1037/met0000144
Meece, J. L., Glienke, B. B., & Burg, S. (2006). Gender and
motivation . Journal of School Psychology, 44(5),
351-373. https://doi.org/10.1016/j.jsp.2006.04.004
Muthén, L. K., & Muthén, B. O. (1998-2017). Mplus User’s
Guide (8th ed.). Los Angeles, CA: Muthén & Muthén.
Pajares, F., Miller, M. D., & Johnson, M. J. (1999). Gender
differences in writing self-beliefs of elementary school students.
Journal of Educational Psychology, 91(1),
50-61. https://doi.org/10.1037/0022-0663.91.1.50
Pintrich, P. R., & De Groot, E. V. (1990). Motivational and
self-regulated learning components of classroom academic
performance. Journal of Educational Psychology, 82(1),
33-40. https://doi.org/10.1037/0022-0663.82.1.33
Rist, R. (1970). Student social class and teacher expectations:
The self-fulfilling prophecy in ghetto education. Harvard
Educational Review, 40(3), 411-451.
https://doi.org/10.17763/haer.40.3.h0m026p670k618q3
Rosenthal, R., & Jacobson, L. (1968). Pygmalion in the
classroom. The Urban Review, 3(1), 16-20.
https://doi.org/10.1007/BF02322211
Salahu-Din, D., Persky, H., & Miller, J. (2008). The
nation’s report card: Writing 2007 (NCES Report No.
2008-468). National Center for Education Statistics.
Santangelo, T., Harris, K. R., & Graham, S. (2016).
Self-regulation and writing: An overview and meta-analysis. In C.
MacArthur, S. Graham, & J. Fitzgerald (Eds.), Handbook of
writing research (Vol. 2, pp. 174– 193). Guilford.
Stotsky, S. (1983). Research on reading/writing relationships: A
synthesis and suggested directions. Language Arts, 60(5),
627-642. URL: https:// www.jstor.org/stable/41961512
Tenenbaum, H. R., & Ruck, M. D. (2007). Are teachers'
expectations different for racial minority than for European
American students? A meta-analysis. Journal of Educational
Psychology, 99(2), 253-273.
https://doi.org/10.1037/0022-0663.99.2.253
Virginia Department of Education (2015). Virginia standards
of learning assessments technical report: 2014-2015
administration cycle . Retrieved from
http://www.doe.virginia.gov/testing/test_administration/technical_reports/sol_technical_report_2014-15_administration_cycle.pdf
Willingham, W. W., Pollack, J. M., & Lewis, C. (2002). Grades
and test scores: Accounting for observed differences .
Journal of Educational Measurement, 39(1), 1-37.
https://doi.org/10.1111/j.1745-3984.2002.tb01133.x
Winne, P. H., & Hadwin, A. F. (1998). Studying as
self-regulated learning. In Hacker, D. J, Dunlosky, J., &
Graesser, A.C. (Eds.), Metacognition in educational theory
and practice (pp. 277-304). Routledge.
Woodcock, R., & Johnson, M.B. (1977). The
Woodcock-Johnson Psycho-Educational Battery. DLM Teaching
Resources.
Wooldridge, J. M. 2016. Introductory econometrics: A modern
approach (6th ed.). Cengage.
Zimmerman, B. J. (2008). Investigating self-regulation and
motivation: Historical background, methodological developments,
and future prospects. American Educational Research Journal,
45(1), 166-183. https://doi.org/10.3102/0002831207312909
Zimmerman, B. J. (2013). Theories of self-regulated learning and
academic achievement: An overview and analysis. In B. J. Zimmerman
& D. H. Schunk (Eds.), Self-regulated learning and
academic achievement: Theory, research, and practice (pp.
10-45). Routledge.
Zimmerman, B.J., & Bandura, A. (1994). Impact of
self-regulatory processes on writing course attainment. American
Educational Research Journal, 31(4), 845 – 862.
https://doi.org/10.3102/00028312031004845
Zimmerman, B., & Riesemberg, R. (1997). Becoming a
self-regulated writer: A social cognitive perspective. Contemporary
Educational Psychology, 22, 73–101.
https://doi.org/10.1006/ceps.1997.0919
Zumbrunn, S. (2014, February). Perceived writing climate as a
predictor of student writing self-efficacy and self-regulation.
Paper presented at the Writing Research across Borders Conference,
Paris, France.
Zumbrunn, S., Marrs, S., & Mewborn, C. (2016). Toward a better
understanding of student perceptions of writing feedback: a mixed
methods study. Reading and Writing, 29
(2), 349-370. https://doi.org/10.1007/s11145-015-9599-3
Results from Multilevel Multinomial Logistic Regression Predicting Writing Grades
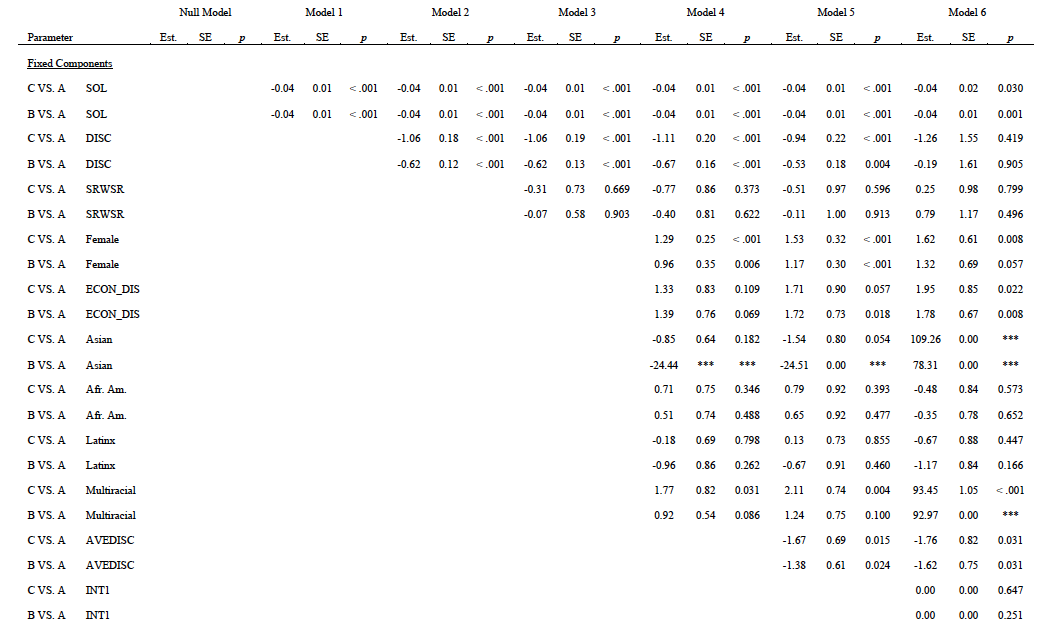

Notes. N = 201. SOL = Standards of Learning test score.
DISC = discrepancy score. ECON_DIS = Student classified as
economically disadvantaged. INT1 = SOL x Discrepancy interaction
effect. INT2 = SRWSR x Discrepancy interaction effect. INT3 =
Female x Discrepancy interaction effect. INT4 = Econ_Dis x
Discrepancy interaction effect. INT5 = Asian x Discrepancy
interaction effect. INT6 = African American x Discrepancy
interaction effect. INT7 = Latinx x Discrepancy interaction
effect. INT8 = Multiracial x Discrepancy interaction effect.
Coefficients reported here are log odds coefficients (logits).