![]()
Frontline Learning Research Vol.8 No. 3 Special
Issue (2020) 10 - 25
ISSN 2295-3159
aFaculty of Education, The
University of Hong Kong, Hong Kong
bSeinan Gakuin University, Fukuoka, Japan
Article received 1 June 2019 / revised 4 December/ accepted 6 December / available online 30 March
Self-report is a fundamental research tool for the social sciences. Despite quantitative surveys being the workhorses of the self-report stable, few researchers question their format—often blindly using some form of Labelled Categorical Scale (Likert-type). This study presents a brief review of the current literature examining the efficacy of survey formats, addressing longstanding paper-based concerns and more recent issues raised by computer- and mobile-based surveys. An experiment comparing four survey formats on touch-based devices was conducted. Differences in means, predictive validity, time to complete and centrality were compared. A range of preliminary findings emphasise the similarities and striking differences between these self-report formats. Key conclusions include: A) that the two continuous interfaces (Slide & Swipe) yielded the most robust data for predictive modelling; B) that future research with touch self-report interfaces can set aside the VAS format; C) that researchers seeking to improve on Likert-type formats need to focus on user interfaces that are quick/simple to use. Implications and future directions for research in this area are discussed.
Keywords: : Likert; VAS; Slide; Self-report; Response format; Experimental design; Mobile; Touch interface
The present special issue (Fryer & Dinsmore, 2020) has planted its flag in an unpopular or extremely popular—depending on your perspective—area of research. Unpopular because of the nature of self-reported data: if it is qualitative, it lacks external validity, and if it is quantitative, it is ordinal at best. Unpopular because it is, after all, just intra-psychic “stuff”, only loosely tied to the observed, interval/ratio construct gold standards (i.e., our own version of physics envy; see Howell, et al., 2014). Popular because very few researchers in the social sciences can avoid self-report in some form or another. For these reasons, and the fact that year on year humankind collects and analyses more self-report data than ever before, self-report data, and how it is collected, deserves more of our attention.
Although there are many, many means of collecting these self-reports, surveys/questionnaires are the most ubiquitous. Despite the fact that the two most popular formats for surveys have been around for nearly a century (i.e., Visual Analogue Scale VAS1, Hayes. & Patterson, 1921; Likert, Likert, 1932), very little has been done to improve on them. The scant existing research comparing them has often concluded with a statement equivalent to “same difference”.
Only during the past two decades has the ground begun to shift under Likert and VAS formats. Computers made slider formats possible, VAS easier to implement and, survey data in all formats far easier to obtain. Mobile devices have led to a natural expansion in the amount of surveys, but little actual development in how they are conducted.
Towards this development the current study presents longstanding issues (commonly and rarely addressed) alongside newer factors made prominent by computer and mobile survey interfaces. This short review is complimented by an experimental study comparing Labelled Categorical Scale (LCS; a Likert format with no center/neutral point), VAS, Slider (a sliding bar with labels and numbers) and a new format/interface (Swipe; an adaptation/extension of the slide format) for collecting quantitative self-reported, micro-analytic data regarding students’ interest in classroom tasks.
There are many means of collecting self-reported information, but the most common means of self-report across all fields of human sciences are surveys measuring agreement to a set of statements across a numerical scale of some type (See Durik & Jenkins, 2020). Being the most common type of self-report, surveys also receive the most criticism. These censures generally focus on two critical weaknesses inherent in survey data. The first is the often ordinal (or at least not technically interval) nature of the data itself. The second concern has two related parts, the first is that it is latent and therefore invisible to the senses, the related second part is the data's often tenuous (and generally indirect) connection to the observed world. Nearly every researcher working with survey data has received a review of their manuscript pointing to one or both of these concerns as a limitation – if not as a reason for rejection.
Despite these acknowledged weaknesses, self-reported data are often the only or most direct means (at a large scale) of getting at human psychology. The obvious areas it is critical in assessing are intra-psychic aspects like beliefs, motivations, and emotions. Less obvious, but an equally important area where self-reports are essential tools, are processes which are partially evident to the observer, but like an iceberg are mostly submerged: i.e., metacognitive and cognitive strategies.
In addition to the broad concerns regarding the fact that these data are "just self-reported", there are a host of other issues less often discussed, and often unresolved, with quantitative survey data. The current study presents a brief review of some of these issues ranging from those that are (a) longstanding and commonly addressed, to (b) longstanding less often discussed, and finally (c) modern issues specific to computer and mobile (touch) interfaces. Following this brief "highlight" review supported by recent research from a range of domains, a short experimental study examining four touch interfaces, with four self-report formats, for collecting survey data through mobile phones immediately after classroom experiences will be presented. Discussion will seek to tie the review and experiment together, while lighting the way for more understanding, research and general development in this critical, but often unquestioned area of research methods.
Before engaging with less often addressed issues with survey data, two important concerns commonly addressed through design and analyses should be noted. The first is the "less than interval" nature of survey data (i.e., it might be continuous but who knows what "it" is). This problem is generally addressed along with construct validity and reliability by the use of multiple items and either mean- or, preferably, latent-variable analysis. Latent-variable analysis is preferred for a range of reasons, of which measurement error is most commonly cited. Algorithms such as those natively used by latent software packages like Mplus (Muthén & Muthén, 1998-2015) are purported to ameliorate the stepwise nature of ordinal data, smoothing the distribution that classical statistics relies upon. Reliability is supported by scales utilising items with similar content and reliability that can be assessed at a latent level (Raykov, 2009), offering flexibility to latent modelling research.
Some of the longstanding, but often left unspoken, issues with survey data include central tendency, ceiling effects, number of appropriate categories, influence of proximal items, and self-report agreement vs. magnitude. Central tendencies generally occur when survey respondents over subscribe to middling amounts of agreement and can be related to the use of a non-committal category (Foddy, 1994). While central tendency has long been seen as bias, recent Bayesian analysis suggests it might actually be a reflection of the probability of surveyed choice (Douven, 2018). This is still an unresolved issue and many researchers will no doubt continue to blame scale midpoints as the source of this problem.
Likert format surveys (Voutilainen, et al., 2016) and the survey statements themselves (Austin & Brunner, 2003) have been linked to ceiling effects. Ceiling effects are when a large proportion of survey respondents report the highest possible scale value. Like central tendency biases, ceiling effects can affect the normality of data and result in Type I errors (Austin & Brunner, 2003).
The number of appropriate categories in survey report formats is one of those issues that all researchers have to face when designing instruments and often results in a best guess. Linked with concerns regarding central tendency, these questions also focus on odd vs. even numbers of categories (e.g., Adelson & McCoach, 2010).
The last issue is that of the difference between agreement with survey labels and the magnitude of that agreement (Berger & Alwitt, 1996). A two-step approach, with a Likert response format followed by a cumulative scale from not very strong to very strong has been suggested as a mechanism for assessing both aspects of respondents' experience (Albaum, 1997). While this pairing of self-report has presented robust predictive strength for related variables, this line of research has not been consistently pursued (see Durik & Jenkins, 2020).
Four relatively new issues that computer and now mobile interfaces are making central are (a) The use and number of labels and/or ticks on a slider or VAS report scale line (no longer focused on explicitly stated categories), (b) Precision in selecting the level of self-report, (c) Speed in selection, (d) Bias due to everything from age to education, and (e) Relative non-response to different scale formats. For most of these issues there is only a budding body of research to draw upon.
Matejka, et al. (2016) is to our knowledge the only in-depth study testing the effect of the number of ticks (on a slide line) on self-report precision and speed. This study indicated that with regard to precision that 11 ticks is superior to five. This study also supported the use of dynamic feedback (a running quantitative score above the moveable slide marker). This addition enhances precision but has a detrimental effect on the speed of self-report. This study also pointed to the benefit of banded coloring of the slider line to signify increments as being superior to ticks alone.
Bias is a complex area to research and has not to our knowledge been properly investigated with studies supported by experimental design. Survey studies have noted apparent biases supporting Labelled Categorical Scale (LCS; i.e., Likert-type) interfaces over Slide and VAS interfaces (Voutilainen et al., 2016). This research attributes the benefits of LCS to age (i.e., easier for older and younger respondents) and/or education (i.e., easier for respondents with less education). Their very specific supposition regarding bias reflects broad support for LCS over other continuous survey interface formats.
A considerable number of studies, in a wide range of domains have assessed the relative usefulness of different survey interfaces. The majority have focused specifically on LCS and VAS, which have been the predominant self-report formats. On comparing LCS and VAS, most studies conclude that they are highly correlated and present similar overall distributions of data (Bolognese et al 1990; Reed, et al., 2017; Vickers, 1999). If we include ease of administration, these studies generally support the use of LCS over other formats (i.e., generally VAS).
A smaller number of studies comparing LCS and VAS have cited similar consistencies between the two-survey format but fallen on the VAS side of the fence. These studies often cite the interval nature of the VAS data relative to the ordinal nature of LCS data (Bishop & Herron, 2015). Some of these studies also note VAS’ robustness to ceiling effects and, in some cases, shorter time to complete when compared to LCS (Couper, et al., 2006; Voutilainen et al., 2016). Lower standard deviation for VAS vs. LCS has been reported, but has been difficult to replicate (Kuhlmann, et al., 2017).
As more surveys go online there has been a related increase in research examining slider interfaces as self-report tools. This research is generally focused on specific aspects of sliders, rather than comparing them to VAS or LCS (radio button) interfaces. What little comparative research there is has suggested no significant differences between Slider and LCS response formats (e.g., Roster, et al., 2015). Research has also pointed towards non-response being higher for Slider compared to LCS response formats (Liu, 2017). Research of specific Slider related issues such as direction (Liu, 2017), suggest that the direction of the labels has no effect on self-report outcomes. The starting values for Slider markers have an impact on 101, but not 21 or seven-point scales. However, forcing users to click the scale to start (i.e., no marker initially visible), increases missing data, particularly for 101-point scales (Liu & Conrad, 2018).
The present review provides scant clear direction for continued research in the area of survey responses. The majority of the studies presented have pursued a relatively weak research design (Liu and colleagues' programme is a nice exception to this problem) and focused exclusively on longstanding 20th century approaches to survey response formats (LCS and VAS). In line with more recent research focused on computer-based surveys and the growing use of sliders, the future of self-report (like almost everything else) is mobile and touch based. It is critical that as our medium for engaging with media changes, that we adapt the ways in which we structure these media. For example, researchers should consider why we often use a touch radio button when something more intuitive and potentially more powerful might be invented. As Wetzel and Greiff (2018) have called for, future research needs to seek alternative response formats. In the current study we therefore pursued an experimental approach (i.e., random assignment of a three-item survey's scale interface) to testing both well-known and new response formats on mobile touch-based devices.
Four survey interfaces were compared: Labelled Categorical Scale (Likert-type), VAS, Slider, and Swipe. The first two were included due to their prevalent use across the previous century of research. The third (Slider) was included because of its increasing use through computer and now mobile devices. The fourth (Swipe; Fryer & Fryer, 2019) was included to test some new and alternative approaches that touch interfaces afford. Swipe is built on a basic Slider interface, but is presented on a slope. Users “swipe” along the 45-degree angle (up, left to right) to move a ball up the incline. Consistent with Matejka et al. (2016), this interface integrated dynamic feedback and an approach to banding the intervals between labels in addition to ticks. Ticks were presented both for the six labels and at 1/10 increments between the labels.
In the current study we aimed to highlight established issues with survey data, some of which are regularly addressed, and others less often discussed. In the current study we also aimed to introduce new questions that survey measurement faces as it integrates with the digital, increasingly mobile age. Embracing this mobile era of survey use, the current study concludes with a brief experimental study comparing the four survey interfaces: LCS, VAS, Slider and Swipe.
Five research questions (RQ) were addressed in the current study’s experiment. Sufficient prior research existed to support a hypothesis for one of the questions, the lower time to complete for LCS (Likert type in most cases) relative to other interface formats. First, we were interested in whether the reliability (Cronbach’s Alpha) for scales would vary meaningfully across the four self-report interfaces (RQ1). Second, we aimed to determine whether any mean differences in interest for each of the six tasks separately could be attributed to the four interfaces (RQ2). Third, we aimed to assess/compare the predictive relationships from (a) prior interest and self-efficacy to the task interest (with each interface) and then (b) from the task interest to future interest in the course and domain (RQ3). Fourth, we sought to assess and compare the latent structure of the interest constructs measured by each of the four interfaces (RQ4). Fifth, potential differences in central tendency of the data resulting from each interface were compared, looking for patterns of response bias that might be due to the four interfaces (RQ5). Finally, we were interested in whether the time to complete the surveys varied meaningfully across the four interfaces. In this case, we hypothesised that Likert would be the fastest to complete (Hypothesis-1).
Participants for the current study were postgraduate students (n = 81; Female = 38; resulting in 644 responses) from one research intensive university in Hong Kong. Students came from eight of the university's 10 faculties. Students were completing a short course in preparation for teaching responsibilities as a part of their degree.
The comparison of the four interfaces (survey formats) was undertaken within a broader project examining students' interest in course tasks, the course itself, and the domain of teaching and learning. Across the course, participating students responded to short surveys either directly after tasks (task interest) or at the beginning/end of the course (course and domain interest). All surveys were completed during regular class time.
Students completed the short surveys on their mobile phones by capturing a QR code (embedded in course power points) which directed them to a survey within a custom designed online platform for micro-analytic surveys. The survey interface students engaged with were randomised for each survey QR code, meaning that students had an equal chance of facing any of the four interfaces for each of the six task interest surveys they were asked to complete. In the current study we therefore pursued a within-individual experimental design. As the interfaces were randomised for each of the six surveys, there was no guarantee that students would engage with all four interfaces and even if, by chance, they did, the number could not be even. This means that this study also relied on between student differences as well.
For the main component of the current study (a comparison of four quantitative self-report interfaces) a three-item survey designed to assess students' interest in a specific task was utilised: This activity/task is personally meaningful; This activity/task is interesting; I want to learn by doing more activities/tasks like this. The predictive validity for the task scales were tested using regression from a future course interest scale consisting of five items (i.e., This course is personally meaningful; This course is interesting; I want more courses like this; I'm enjoying learning about teaching during this course; This course stimulated my curiosity about teaching) and a domain interest scale consisting of five items (i.e., 1) How much do you know about teaching?; In your spare time, how often have you tried to learn about teaching?; I have spent time learning about teaching on my own. How well does this statement match you?; I'm confident in my knowledge of teaching. How well does this statement match you?; I always have questions about teaching. How well does this statement match you?). All survey items were self-reported across a scale 0-5. Labels for Task, Course and Domain (3, 4, 5) asked students to what degree the item matched them specifically (Not at all 0 - Completely 5). Domain item 1 used the labels Almost Nothing 0 - Almost Everything 5. Domain item 2 used the labels Almost Never 0 - Almost Always 5. The task and course scales have demonstrated acceptable reliability and construct validity in several past uses (Fryer, et al., 2020; Fryer, et al., 2019; Fryer, et al., 2017; Fryer, et al., 2016). The domain-level, depth of interest scale was developed recently (Renninger, & Schofield, 2014). It is consistent with current conceptions of individual interest and its development (i.e., Renninger & Hidi, 2015).
In preparation for the current study, ethical approval was sought and obtained from the University’s Human Research Ethics Committee (Ethics Approval #1608028). Prior to beginning the study, all students read an overview of the project, were informed that their self-reports would be anonymous and invited to contribute their self-reports to the research project. Six students declined to participate in the research after reading the ethics statement and were removed from the current study, resulting in the aforementioned n-size.
Analysis for the empirical component of the current study began with an examination of the overall and interface specific descriptive statistics for the scale means and reliability (RQ1). ANOVA were conducted for the four interfaces, overall and task by task (RQ2). Regressions were conducted from prior Domain interest and Course self-efficacy predicting Task interest for each interface separately; then regressions from Task interest predicting Course interest in the future was conducted and compared (RQ3). Factor loading (Confirmatory Factor Analysis) for results from each interface was then compared (RQ4). The central tendency, both visual and Skew/Kurtosis were calculated and reviewed (RQ5). Finally, an ANOVAs were conducted to compare completion times for each interface (Hypothesis #1).
The overall means for the four interfaces (across all six tasks), for the pre-post measure, their differences by task, and scale reliabilities are presented in Table 1. The reliability for each scale and for the task interest scales used with each of the four interfaces were all well above what is commonly suggested as being acceptable (> .70; Devellis, 2012). Significant differences were observed for the four interfaces across the project as a whole, but at each of the individual tasks assessed for interest no statistically significant differences were found (Table 1 & 2).
Table 1
Means, Cronbach’s Alpha and ANOVA for the four interfaces across all tasks
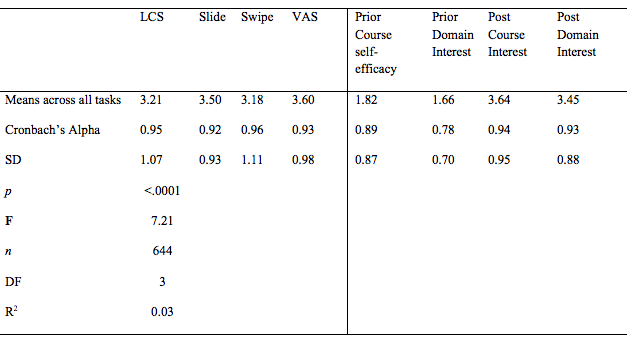
Table 2
ANOVA for differences for each task

Note: Task Interest means for Tasks a-f for each
self-report format
Regression was used to experimentally test (i.e., random assignment of interface) the prediction from prior domain interest and perceived self-efficacy for the course to the four survey interfaces used for all the six tasks (combined). This test was then followed by regression predicting future interest in the course and domain from students’ interest in the course tasks, again for each of the task interest survey interfaces (Table 3). For the prediction from prior domain interest to future tasks, the R2 (.04) was consistent for all but VAS, which presented a non-significant (p < .05) relationship. Course self-efficacy was significant for all four interfaces presenting the highest R2 the new interface (swipe = .09) and the lowest for VAS (.06). Task interest predicting future interest in the course (generally strong in past research with these constructs: e.g., Fryer, et al., 2019; Fryer, et al., 2017; Fryer, et al., 2016) resulted in substantially more variance being explained (R2) (Slide = .49, Swipe = .37, VAS = .29, LCS = .28). A similar pattern of relationships resulted for tasks predicting future domain interest (Slide = .51, Swipe = .37, LCS = .35, VAS = .33).
Table 3
Regression Findings

Note: n refers to the number of survey completions
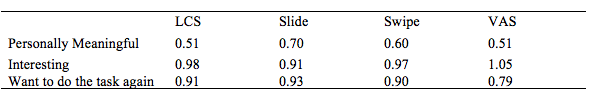
The CFA loading findings were generally consistent across the four interfaces (Table 4). “Interesting” generally presented the strongest loading, followed by a desire to reengage and finally perceptions of tasks being personally meaningful.
Table 4.
CFA loading for each item for each survey question format
The average time to complete the task surveys with each of the four interfaces was calculated and compared (Table 5). Despite the relatively large mean differences, no statistically significant differences were observed (p < .05). This is likely due to the relatively large standard deviation for the means.
Table 5
Average time to complete task surveys with each of the four interfaces
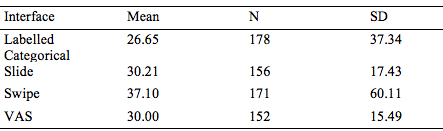
Note: n refers to the number of survey completions with
the specified format
Central Tendency
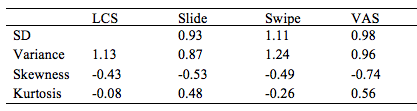
Table 6 presents the distribution for the four tested interfaces. Skew and kurtosis for each of the interfaces were within even the strictest heuristics (+1 – -1). The graphical distribution for each survey interface is included in the Appendices (Figures 1-4). The distribution presented by these charts makes visually clear the inherent differences between the types of data the different interfaces result in. VAS presents the most skew and LCS appears to encourage students to choose the same ordinal rank, regardless of question, resulting in large amounts of twos, threes and fours but far fewer scores in between. Swipe and Slide presented the most normal looking distributions.
Table 6
Distribution for the four interfaces
A brief review of the extant research in the area of quantitative survey self-report formats (or interfaces in the current context) was presented. The literature reviewed came from a broad range of fields, with much of it providing scant direction beyond support for LCS (commonly Likert in format) due to its ease of administration and in some cases for VAS due to the nature of the resulting data (i.e., interval-like). More recent research examining Slider formats has resulted in a handful of incremental suggestions for the field (e.g., use of dynamic response and potential of banding rather than ticks on the slide area) which have not yet been meaningfully taken up by the field. Some of these findings were integrated into the interface tested alongside LCS, VAS and Slide, in a touch-driven format tentatively named Swipe (an early version of Fryer & Fryer, 2019).
In the short experimental study undertaken, six research questions were addressed. Reliability for each of the interfaces was acceptable, with Swipe and LCS presenting the highest reliability across the 6 tasks (RQ1). No statistically significant mean differences were found for the individual tasks (Table 2), but a significant difference across all tasks was observed—albeit with a small R2 (Table 1). In this case VAS presented the highest overall mean and slide the lowest (RQ2). Predictive modelling was undertaken – prior self-efficacy for the course and interest in the domain predicting future course interest; Task interest predicting future Course and Domain interest – for each of the four interfaces. The clearest contrast was for Task to future Course and Domain interest, where Slide and then Swipe presented the strongest relationship (RQ3). Confirmatory Factor Analysis followed, focusing on item loading, with results suggesting a consistent pattern of loading across the four interfaces (RQ4).
Central tendency for the responses were examined statistically and reviewed graphically (Appendices: Figures 1-4). Skew and Kurtosis were within acceptable boundaries for all four interfaces. Graphical representations of the four distributions suggested that the Swipe interface presented the most normal distribution (RQ5). The time to complete the three-question survey with the four interfaces was compared, indicating that, consistent with our hypothesis, the LCS format was the fastest to complete (but not statistically significant, p < .05) (Hypothesis #1). A careful review of the data across the six surveys suggest that the differences between the LCS and the other formats declined precipitously with increased use suggesting a learning effect (i.e., getting used to the new interface) across students’ engagement with the task interest self-reports.
Assuming the sample size was large enough for the experimental nature of the study (i.e., random distribution of the four conditions), two general findings standout. The first is the relative predictive strength of responses with each of the four interfaces. Slide, followed by the new interface Swipe, stood out as presenting the strongest βs for future interest in the course and domain. Given the fact that much of the research with surveys like this will be aimed at predictive modelling, this finding is both alarming and potentially hopeful: Alarming as the results suggest that the interface matters and can result in substantial differences; hopeful because it suggests that the Slide and Swipe (i.e., interactive and touch-based) formats have significant advantages over older formats like LCS and VAS.
The second is the time difference to complete the survey. Marked differences supporting past findings pointing to the ease of LCS over other formats like VAS were observed. Rather than suggesting, as many previous researchers have, that LCS is therefore preferred due its ease of administration, we suggest that the flexible nature of mobile devices might be channeled to overcome this issue. A careful review of the survey completion time data suggested that the difference between LCS and Slide/Swipe narrowed substantially with increasing use. More intuitive interfaces for Slide/Swipe might be developed to close the gap, and animated directions for interacting with the interfaces might also be used to ameliorate this issue.
While the skew and kurtosis outcomes for each interface were within acceptable boundaries, the graphical presentation made a clear case for Swipe, VAS and Slide (in that order) as providing a more normal distribution of scores. Given the reliance of most of our statistical procedures on such a distribution and the amount of potential data collected with mobile interfaces in the years to come, it seems reasonable to continue to develop continuous self-report interfaces.
Despite the experimental design, this study faced a number of limitations that should be addressed by future studies in this area. The first is the learning effect that is apparent for all of the continuous interfaces, but most obvious for the newest version (Swipe). The high SDs that resulted, clearly affected the study’s power to detect differences between the interfaces which were apparent in the means but were not statistically significant. In this study only participants’ responses to a very short survey were examined, whereas most surveys are much longer. Future studies should examine what effect prolonged survey engagement has on different touch interface experiences as well. While more than 600 individual responses across the four interfaces were collected for this study, the actual sample of participants was quite small and very specific. It is important that future studies embrace a broader sample as well as a larger one.
Implicit in the study's design, analyses were conducted between persons, but participants were represented at multiple time points. This design therefore violates the assumption of independent errors as some of the data is nested within-person. To achieve the sample size necessary for a meaningful experimental test of all four interfaces, this limitation could not be avoided. A future experiment in a more controlled context (rather than a classroom setting) could undertake to obtain a clear counter-balanced sample and avoid this limitation.
This was the first published test of the Swipe interface (a pilot version). This test suggested both positive (high βs and reliability) and negative findings (high SDs and time to complete) for the new interface. Future studies from our research programme continue to refine this approach to self-report. The most recent version of the interface (Fryer & Fryer, 2019) is prefaced by an animated user interface infomercial (to spell out how to interact with it). Additional tests comparing Swipe with the Slide (highest βs) and LCS (fastest time to complete) are being conducted towards fine-tuning this new dynamic, touch-based survey interface.
It is critical to note that the present study's questions focus on students' self-reported emotions, beliefs and desires. It is reasonable therefore to constrain the implications of our results to the use of similar types of survey questions.
One means of continuing to advance the research presented here would be through pairing Think-aloud protocols with survey use (e.g., Chauliac, et al., 2020; Rogiers, et. al., 2020). This would provide a small window into the user's mind, suggesting how/whether a specific self-report format and touch interfaces interact with the self-report experience and outcome: i.e., send in a spider to catch the fly.
An additional important area for investigation is that of surveys which enable the seamless integration of both categorical choice and continuous magnitude. To some degree the Swipe interface sought to combine these elements into a single experience. Future interfaces might extend this work or separate them into an intuitive two-step process: choose a label and then indicate the strength of your feeling for that category (see Durik & Jenkins, 2020).
VAS and Likert-type (LCS) formats are approaching their centenary. At the same time humankind sprints towards touch-based mobile devices as a critical nexus for interacting with and managing its world. Self-report is therefore ripe to be improved (disrupted?). The revolution must start with those of us that rely on surveys for research. Better, easier measurement means clearer results and more of them. As one baby step towards this revolution, results from the present study suggest that VAS might be set aside as an option. It presented no clear benefits over the other interfaces in any of the tests and lacks any clear path to enhancement. In contrast, the present research suggests that continuous and interactive formats (Slide & Swipe) are a strong base for development in this area. The field is waiting for researchers with a penchant for disruptive improvement.
Notes:
1. Visual Analogue Scale (VAS) is "a testing technique for
measuring subjective or behavioral phenomena (as pain or
dietary consumption) in which a subject selects from a
gradient of alternatives (as from "no pain" to "worst
imaginable pain" or from "every day" to "never") arranged in
linear fashion". (Merriam Webster, 2019)
2. A Likert scale is a "rating system used in questionnaires,
that is designed to measure people’s attitudes, opinions, or
perceptions. Subjects choose from a range of possible
responses to a specific question or statement; responses
typically include “strongly agree,” “agree,” “neutral,”
“disagree,” and “strongly disagree.” Often, the categories of
response are coded numerically, in which case the numerical
values must be defined for that specific study, such as 1 =
strongly agree, 2 = agree, and so on." (Britannica, 2019)
We would like to acknowledge the contribution of Alex Shum for carefully reviewing a previous draft and his overall contribution to this ongoing project. We would also like to acknowledge Ada Lee and Peter Lau who were central to collecting the data for this research and the broader programme.
Adelson, J. L., & McCoach, D. B. (2010). Measuring the
Mathematical Attitudes of Elementary Students: The Effects of a
4-Point or 5-Point Likert-Type Scale. Educational and
Psychological Measurement, 70 (5), 796-807.
https://doi.org/10.1177/0013164410366694
Albaum, G. (1997). The Likert scale revisited. Market
Research Society. 39(2), 1-21.
https://doi.org/10.1177/147078539703900202
Austin, P. C., & Brunner, L. J. (2003). Type I error inflation
in the presence of a ceiling effect. The American
Statistician, 57(2), 97-104.
https://doi.org/10.1198/0003130031450
Berger, I., & Alwitt, L. F. (1996). Attitude conviction: a
measure of strength and function. Unpublished paper.
Bishop, P. A., & Herron, R. L. (2015). Use and misuse of the
Likert item responses and other ordinal measures. International
journal of exercise science, 8(3), 297-302.
Boognese, J. A., Schnitzer, T. J., & Ehrich, E. (2003).
Response relationship of VAS and Likert scales in osteoarthritis
efficacy measurement. Osteoarthritis and Cartilage, 11(7),
499-507. https://doi.org/10.1016/S1063-4584(03)00082-7
Britanica.com (2019). Likert definition. Retrieved on November 18,
2019 from https://www.britannica.com/topic/Likert-Scale
Couper, M. P., Tourangeau, R., Conrad, F. G., & Singer, E.
(2006). Evaluating the effectiveness of visual analog scales: A
web experiment. Social Science Computer Review, 24(2),
227-245. https://doi.org/10.1177/0894439305281503
Chauliac, M., Catrysse, L., Gijbels, D., & Donche
V. (2020). It is all in the surv-eye: can eye tracking data shed
light on the internal consistency in self-report questionnaires on
cognitive processing strategies? Frontline Learning Research.
8(3), 26 – 39. https://doi.org/10.14786/flr.v8i3.489
Devellis, R. F. (2012). Scale development: Theory and
application. New York: Sage
Douven, I. (2018). A Bayesian perspective on Likert scales and
central tendency. Psychonomic Bulletin & Review, 25,
1-9. https://doi.org/10.3758/s13423-017-1344-2
Durik, A. M., & Jenkins, J. S. (2020). Variability in
certainty of self-reported interest: Implications for theory and
research. Frontline Learning Research, 8(2)
86-104. https://doi.org/10.14786/flr.v8i3.491
Foddy, W. (1994). Constructing questions for interviews and
questionnaires: Theory and practice in social research. Cambridge:
Cambridge university press.
Fryer, L. K., Thompson, A., Nakao, K.,
Howarth, M., & Gallacher, A. (2020). Supporting self-efficacy
beliefs and interest as educational inputs and outcomes: Framing
AI and Human partnered task experience. Learning and
Individual Differences.
https://doi.org/10.1016/j.lindif.2020.101850
Fryer, L. K., & Dinsmore D.L. (2020). The Promise and Pitfalls
of Self-report: Development, research design and analysis issues,
and multiple methods. Frontline Learning Research, 8(3),
1–9. https://doi.org/10.14786/flr.v8i3.623
Fryer, L. K., Nakao, K., & Thompson, A. (2019). Chatbot
learning partners: Connecting learning experiences, interest and
competence. Computers in Human Behavior, 93, 279-289.
https://doi.org/10.1016/j.chb.2018.12.023
Fryer, L. K., & Fryer, K.
(2019).情報処理装置、情報プログラムおよびこれを記録した記録媒体、ならびに情報処理方法.. Patent # 6585129
(Japan).
TRANSLATION: [Dynamic touch based interface for survey
self-report; Translation of Japanese patent title: information
processor (information technology equipment), information program
and a medium for the recording, and a method of information
processing]
Fryer, L. K., Ainley, M., Thompson, A., Gibson, A., &
Sherlock, Z. (2017). Stimulating and sustaining interest in a
language course: An experimental comparison of Chatbot and Human
task partners. Computers in Human Behavior, 75, 461-468.
https://doi.org/10.1016/j.chb.2017.05.045
Fryer, L. K., Ainley, M., & Thompson, A. (2016). Modelling the
links between students' interest in a domain, the tasks they
experience and their interest in a course: Isn't interest what
university is all about? Learning and Individual Differences,
50, 157-165. https://doi.org/10.1016/j.lindif.2016.08.011
Hayes, M. H., & Patterson, D. (1921). Experimental development
of the graphic rating method. Psychological Bulletin, 18, 98-107.
Howell, J. L., Collisson, B., & King, K. M. (2014). Physics
envy: Psychologists’ perceptions of psychology and agreement about
core concepts. Teaching of Psychology, 41, 330-334.
https://doi.org/10.1177/0098628314549705
Jaeschke, R., Singer, J., & Guyatt, G. H. (1990). A comparison
of seven-point and visual analogue scales: data from an andomized
trial. Controlled clinical trials, 11, 43-51. https://doi.org/10.1016/0197-2456(90)90031-V
Kuhlmann, T., Dantlgraber, M., & Reips, U.-D. (2017).
Investigating measurement equivalence of visual analogue scales
and Likert-type scales in Internet-based personality
questionnaires. Behavior Research Methods, 49,
2173-2181. https://doi.org/10.3758/s13428-016-0850-x
Likert, R. (1932). “A Technique for the Measurement of Attitudes”.
Archives of Psychology, 140, 5-55.
Liu, M. (2017). Labelling and direction of slider questions:
Results from web survey experiments. International Journal of
Market Research, 59, 601-624.
https://doi.org/10.2501/IJMR-2017-033
Liu, M., & Conrad, F. G. (2018). Where Should I Start? On
Default Values for Slider Questions in Web Surveys. Social
Science Computer Review, 37(2), 248-269.
https://doi.org/10.1177/0894439318755336
Chauliac, M., Catrysse, L., Gijbels, D. and Donce, V. (2020). It
is all in the surv-eye: can eye tracking data shed light
on the internal consistency in self-report questionnaires on
cognitive processing strategies? Frontline Learning Research.
8 (2), 26 – 39. http://doi.org/10.14786/flr.v8i3.489
Matejka, J., Glueck, M., Grossman, T., & Fitzmaurice, G.
(2016). The effect of visual appearance on the performance
of continuous sliders and visual analogue scales. Paper
presented at the Proceedings of the 2016 CHI Conference on Human
Factors in Computing Systems.
Merriam-Webster. (2019). Visual Analogue Scale definition.
Retrieved on November 18, 2019 from
https://www.merriam-webster.com/dictionary/likert
Muthén, L. K., & Muthén, B. O. (1998-2015). Mplus user's
guide. (Sixth ed.). Los Angeles, CA: Muthén & Muthén.
Raykov, T. (2009). Evaluation of scale reliability for
unidimensional measures using latent variable modeling. Measurement
and Evaluation in Counseling and Development, 42, 223-232.
http://doi.org/10.1177/0748175609344096
Rogiers, A.; Merchie, E. & Van Keer (2020). Opening the black
box of students’ text-learning processes: A process mining
perspective. Frontline Learning Research. 8(3) 40 – 62.
http://doi.org/10.14786/flr.v8i3.527
Reed, C. C., Wolf, W. A., Cotton, C. C., & Dellon, E. S.
(2017). A visual analogue scale and a Likert scale are simple and
responsive tools for assessing dysphagia in eosinophilic
oesophagitis. Alimentary Pharmacology & Therapeutics, 45,
1443-1448.
https://doi.org/10.1111/apt.14061
Renninger, K., & Hidi, S. (2015). The power of interest for
motivation and engagement. New York: Routledge.
Renninger, K., & Schofield, L. S. (2014). Assessing STEM
interest as a developmental motivational variable. Paper presented
at the American Educational Research Association, Philadelphia,
PA.
Roster, C. A., Lucianetti, L., & Albaum, G. (2015). Exploring
slider vs. categorical response formats in web-based surveys. Journal
of Research Practice, 11(1), 1.
Vickers, A. J. (1999). Comparison of an ordinal and a continuous
outcome measure of muscle soreness. International Journal of
Technology Assessment in Health Care, 15, 709-716.
https://doi.org/10.1017/S0266462399154102
Voutilainen, A., Pitkäaho, T., Kvist, T., &
Vehviläinen‐Julkunen, K. (2016). How to ask about patient
satisfaction? The visual analogue scale is less vulnerable to
confounding factors and ceiling effect than a symmetric Likert
scale. Journal of Advanced Nursing, 72, 946-957.
https://doi.org/10.1111/jan.12875
Wetzel, E., & Greiff, S. (2018). The world beyond rating
scales: Why we should think more carefully about the response
format in questionnaires. European Journal of Psychological
Assessment, 34
, 1-5. http://doi.org/10.1027/1015-5759/a000469
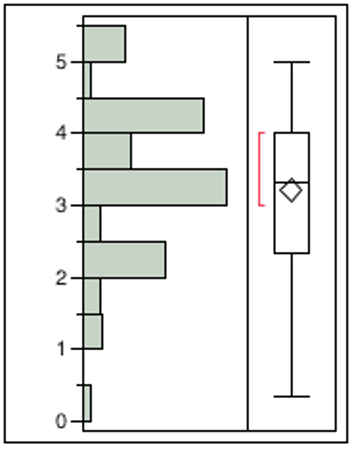
Figure 1. Distributions for Interface for LCS
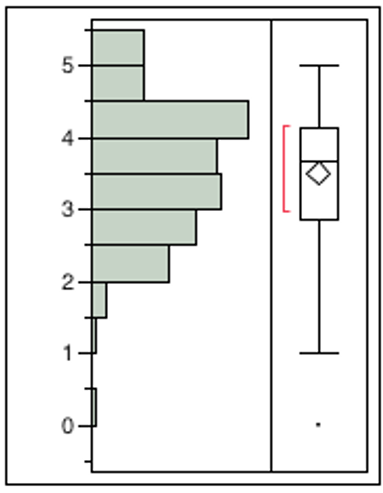
Figure 2. Distributions for Interface for Slide
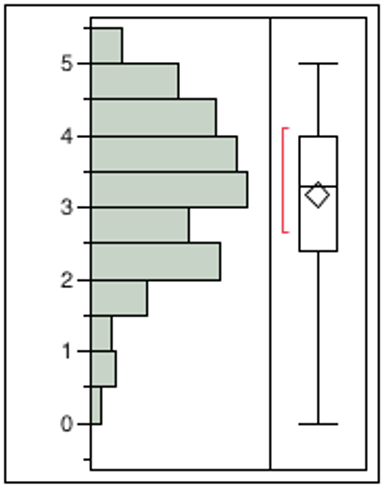
Figure 3. Distributions Interface Swipe

Figure 4. Distribution for VAS Interface