![]()
Frontline Learning Research Vol.4 No. 5 (2016) 62
- 82
ISSN 2295-3159
aUniversity of Oxford, United
Kingdom
bUniversity of Jyväskylä, Finland
Article received 16 November / revised 7 July / accepted 7 September / available online 11 January
In order to advance our understanding of educational processes, we present a tutorial of intraindividual variability. An adaptive educational process is characterised by stable (less variability), and a maladaptive process is characterised by instable (more variability) learning experiences from one learning situation to the next. We outline step by step how we specify a multilevel structural equation model of state, trait and individual differences in intraindividual variability constructs, which can be appropriately fitted to intraindividual data (e.g., time-points nested in persons, intensive longitudinal data). In total 285 primary school students’ (Years 5 and 6) completed the Learning Experience Questionnaire using handheld computers, on average 13.6 learning episodes during one week (SD = 4.6; Range = 5-29; nepisodes = 3,433). We defined mean squared successive differences (MSSD) for each manifest indicator of task difficulty, competence evaluation and intrinsic motivation. We also demonstrate how to specify multivariate models for investigating convergent validity of the variability constructs. Overall, our study provides support for intraindividual variability as a construct in its own right, which has the potential to provide novel insight into students’ learning processes.
Keywords: Intraindividual variability; multilevel structural equation model (MSEM); learning experience; ecological momentary assessment
There is a growing interest in the study of students’ learning processes using diary and real-time data (Schmitz, 2006). These micro-longitudinal studies expand our knowledge about learning processes beyond what we can learn from single time-point cross-sectional studies, in at least three ways. First, there is considerable variation in students’ learning experiences, e.g., their engagement, beliefs, motivation, emotions, and performance from one situation to another (i.e., intraindividual variation), more so than there is variation between students (i.e., interpersonal variation; Schmitz & Skinner, 1993). Second, situation-specific learning experiences vary as a function of contextual features, such as perceived autonomy support (Tsai, Kunter, Lüdtke, & Trautwein, 2008), and extrinsic motivation (Malmberg, Pakarinen, Vasalampi, & Nurmi, 2015). This means that situation specific opportunities and constraints, such as provision of support and levels of expectation, form an integral part of students’ learning experiences. Third, students’ individual characteristics can moderate the relationship between experiences. Compared with relatively lower achievers, higher achievers had more stable control beliefs and perceived task ease from one situation to the next (Musher-Eizenman, Nesselroade, & Schmitz, 2002), and exerted more effort when confronted with difficult tasks (Malmberg, Walls, Martin, Little, & Lim, 2013). What we know less about is the intraindividual variability in students’ learning experiences from one situation to the next. Whilst intraindividual variation captures the differences between individuals’ experiences above or below their own average experience (i.e., an “individual standard deviation” of own “ups” and “downs”), intraindividual variability, inconsistency, or instability refers to the magnitude of short-term fluctuations in the order of the ups and downs from one time-point to the next (e.g., Jahng, Wood, & Trull, 2008; Kernis, Grannemann, & Barclay, 1989). This magnitude of intraindividual variability is larger when the shifts between highs and lows are more abrupt, occur more often, and the swings go from one extreme to the other. In the present study we go beyond previous real-time studies of students’ learning experiences in two ways. First, we propose a methodology for specifying a within-person variability construct alongside state and trait constructs, using state-of-the-art multilevel structural equation models (MSEM). The MSEM allows us to model latent constructs net of measurement error at two (or more) levels of data. Second, we include teacher perceived student task-focus as an indicator of convergent validity of students’ intraindividual variability. Accumulated research shows that students, who in the eyes of their teacher are generally task-focused, are: intrinsically motivated, deploy task-focused rather than task-avoidant behavioural engagement, exert effort, seek help when they need it, and persist when they encounter difficulties (Eccles, Wigfield, & Schiefele, 1998; Nurmi, Hirvonen & Aunola, 2008, Zimmerman, 2000). It would be important to know whether students who teachers regard as task-focused, are also more stable in their learning experiences, i.e., less variability in students’ perceptions of task difficulty, competence beliefs and intrinsic motivation from one learning situation to the next. To this end we provide a brief overview of intraindividual research in education, task-focused learning, a didactical example of the mean squared sequential difference (MSSD) index of intraindividual variation, and an MSEM specification.
There appears to be a surge in intraindividual research in education. Since the seminal diary studies by Schmitz and Skinner (1993) and Musher-Eizenman et al. (2002), an up-swing in the number of publications has been seen, for example Schmitz and Wiese (2006), and Tsai et al., (2008). Recent studies have used experience sampling of students’ academic emotions (Goetz, Frenzel, Stoeger & Hall, 2010), coping with boredom (Nett, Goetz & Hall, 2011) and metacognitive strategies (Nett, Goetz, Hall & Frenzel, 2012); ecological momentary assessment studies of effort exertion, competence beliefs and task difficulty (Malmberg, Walls et al., 2013); and contextual activity sampling of university students’ challenge, competence and emotions (Inkinen et al., 2013). Data in these studies were collected at multiple time-points in their natural settings, as close in time as possible to events, thus reducing retrospection bias (Wilhelm, Perrez, & Pawlik, 2012). The importance of the intraindividual perspective on learning experiences is threefold. These studies pave the way for understanding, first, learning processes as they occur in real-time; second, individual differences in such learning processes, and third, how teachers might differentially support individual students. Taken together, an intraindividual approach to learning can help us understand both learning processes and the ways in which teachers can support these (Schmitz, 2006).
In the research fields of personality and psychiatry, affect instability is characteristic of personality disorders (Jahng et al., 2008; Trull et al., 2008), with particular focus on negative mood (Eid & Langeheine, 2003), affect (Eid & Diener, 1999), mood and job satisfaction (Ilies & Judge, 2002), affect and mood instability (Jahng et al., 2008), short-term fluctuations in self-esteem (Kernis et al., 1989), and mood variability (McConville & Cooper, 1997). Expanding into other fields, recent studies of intraindividual variability include secure attachment (La Guardia, Ryan, Couchman, & Deci, 2000), temperament (Hooker, Nesselroade, Nesselroade, & Lerner, 1987), perceived control (Eizenman, Nesselroade, Featherman, & Rowe, 1997), and coping (Roesch et al., 2010).
A range of techniques have been suggested for aggregating measures of within-person variability (for a review, see Jahng et al., 2008): the intraindividual standard deviation (or variance), first-order autocorrelation coefficients r, and the mean square successive difference (MSSD; von Neumann, Kent, Bellinson, & Hart, 1941). While the intraindividual standard deviation is intuitively appealing, it does not capture the frequency of change (Larsen, 1987). The MSSD calculates an aggregate that takes the sequential order of the events into account (Equation 1).
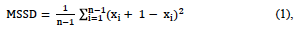
where xi + 1 is the lagged value of xi. The squared difference between xi + 1 and xi assures that the magnitude of the successive differences is captured. There are n-1 observations in the dataset (see Appendix 1). In a didactic simulation shown in Figure 1 we exemplify the conduct of the mean (M), standard deviation (SD), the mean square successive difference (MSSD), and the autocorrelation (r), in three scenarios (Panels A, B and C). For a similar simulation see Jahng et al. (2008).
When we observe the raw data in Panel A (Figure 1) we find that the M and SD are the same as in Panel C, in which the data has been rank-ordered in descending order. The M and SD in Panel B, in which each data-point has been multiplied by two, are the same as multiplying the M and SD of those in Panel A by two. While the SD indeed captures variation, it is not sufficient for capturing the magnitude of variation. The stability over time captured by the autocorrelation r remains the same in Panels A and B, demonstrating that r does not capture the magnitude of change either. The autocorrelation coefficient r is different in Panel C demonstrating that the order of events matter. Finally MSSD differs in all three Panels demonstrating that it is both sensitive to magnitude (Panel B) and order of change (Panel C). In the present study we use MSSD for investigating intraindividual variability.
In previous studies, a range of models for investigating lagged associations have been specified, including time-series and spectral analysis (Larsen, 1987; Ram et al., 2005), the mixed-effects location scale model (Li & Hedeker, 2012), generalized multilevel model (Jahng et al., 2008), and mixture distribution models (Eid & Langeheine, 2003). However, these models do not correct for measurement error in constructs. To do so, we calculated MSSD for each indicator of our latent constructs and modelled these using multilevel structural equation models (MSEM). Although time-series typically requires longer stretches of time-points, the MSSD method is suggested to be robust also for shorter time-series e.g., a number of time-points during each day (Ebner-Priemer, Eid, Kleindienst, Stabenow, & Trull, 2009).
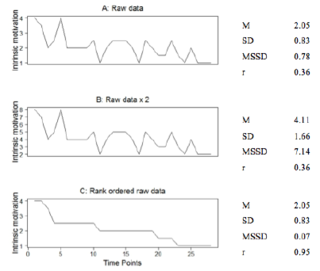
Figure 1. Three example time-series and indices of intraindividual variability (cf. Jahng, et al., 2008).
Note: Panel A represents one sample student for whom 29 situation reports were observed for intrinsic motivation (1 = low motivation, 4 = high motivation). Panel B represents each numerical value in Panel A multiplied by 2, so the scale now spans 2 to 8. Panel C represents the raw data from Panel A but now rank-ordered in descending order. M = Mean, SD = standard deviation, MSSD = the mean square successive difference, and r = autocorrelation.
a) What is the structural validity of the state, trait and
intraindividual variability constructs?
b) What is the association between trait and intraindividual
variability constructs?
c) How do trait and intraindividual variability constructs of
students’ learning experiences converge with teacher-reported
task-focus?
Hypothesis 1: We expected convergence between teacher-reports of students' task-focus (Nurmi et al., 2008), higher level of task-focus positively and moderately associated with trait-levels of each construct, and negatively associated with variability constructs (i.e., higher task-focus less variability, lower task-focus more variability).
In total, 353 students in 16 classrooms in 11 schools participated in the Learning Every Lesson (LEL) study (for details see Malmberg, Woolgar, & Martin, 2013; Malmberg, Walls et al., 2013; Malmberg et al., 2015), with informed parental or guardian consent. The study was carried out in two quite diverse areas in southeast England, UK. Students were asked to complete the electronic Learning Experience Questionnaire (LEQ) for Personal Digital Assistant (PDA) at the end of each learning episode or at least once per lesson. Teachers or teaching assistants were asked to complete a brief one-page report of each student they taught. Teaching arrangements differed across the classes. In half of the classrooms, one teacher reported on all his or her students; in four classrooms two teachers reported on the students; in two classrooms, there was a mix of students with one or two teacher reports; and in another two classrooms, two or three teachers reported.
In order to investigate the correspondence between students’ and teachers’ views of the students, in the final study sample we included all observations for which both teacher and student reports for any given student were available. The intraclass correlation for teacher-reported task-focus was rICC = .08 between classrooms and rICC = .08 between teachers (Malmberg et al., 2015). In order to not burden the models with additional hierarchical levels, teacher reports were aggregated for each student, weighted for the number of experiences with each teacher. However, for the purpose of aggregating MSSD-indices of the lagged relationships between the time-points, we carried out analyses for those students who had at least five time-points of data available (roughly the possible number of reports per day). There were 285 students who reported on 3,433 learning episodes: on average 13.6 learning episodes (SD = 4.6; Range = 5-29) combined with 434 teacher reports (139 students had one teacher report, 143 had two reports and 3 had three reports). Of these there were 126 boys (44.2%) and 159 girls (55.8%), 104 were in Year 5 (36.5%) and 181 in Year 6 (63.5%). They were 10.5 years old on average (SD = 0.64).
Students’ learning experiences were measured using the validated LEQ (reliability, structural and external validity), covering sources of motivation, learning behaviour, competence evaluation and affect (Malmberg, Woolgar, & Martin, 2013).
2.2.1. Task difficulty
Students completed a single item measuring task difficulty: “The learning task I was doing was”, on a four-point scale (1= very easy, 4= very hard).
2.2.2. Competence evaluation
Students responded to two items indicating competence evaluation (Mα = .70; SDα = .18): “how well were you doing at this task” on a five-point scale (1 = poorly, 5 = very well), and “how much did you understand” on a four-point scale (1 = all of it, 4 = none of it; reverse-coded).
2.2.3 Intrinsic motivation
Students were asked “why were you doing this task?” and responded to three items measuring intrinsic motivation: “I enjoyed it”, “I chose to do it”, and “I was interested in it”. When we split the data by day and learning experience, the average internal consistency was Mα = .85 (SDα = .09).
Teachers reported on each student’s task-focused characteristics and behaviour.
2.3.1. Task-focus
We used teacher-reports of each student’s task-focus in school in general. Task-focus was measured with six items modified from the Observer-rating Scale of Achievement Strategies (OSAS; Nurmi, & Aunola, 1998), and the Behavioural Strategy Rating Scale II (BSR-II; Aunola, Nurmi, Parrila, & Onatsu-Arvilommi, 2000; Zhang, Nurmi, Kiuru, Lerkkanen, & Aunola, 2011). Teachers were asked to think about each student’s behaviour and work habits in class, and respond on five-point scales (0 = not at all, 1 = rarely, 2 = sometimes, 3 = often, 4 = very often), to what extent each of the six statements characterise the way each student typically behaves in learning situations. Half of the items were positively worded (indicating task-focus): “actively attempts to solve even difficult tasks”, “demonstrates initiative and persistence in activities and tasks”, and “tries hard to finish even difficult tasks”. The three negatively worded items (indicating task-avoidance) were: “has a tendency to find something else to do, instead of focusing on the task at hand”, “gives up easily”, and “loses focus if a task or activity is not going well” (α = .88). We specified the construct so that higher values indicated more focus on tasks. Task-focus was strongly and positively related to academic performance (Malmberg et al., 2015).
We specified multilevel structural equation models (MSEM) in Mplus (Muthén & Muthén, 2012). At the within level we specified a latent state construct ξW1 using x1 to x3 as indicators (see Figure 2). At the between level, we specified a correspondence between level trait construct ξB1, equating factor loadings across the levels for metric invariance between the state and trait constructs (Morin, Marsh, Nagengast, & Scalas, 2014). We then specified a second between-level construct, which captures interindividual differences in intraindividual variability, ξB2 using k indicators.
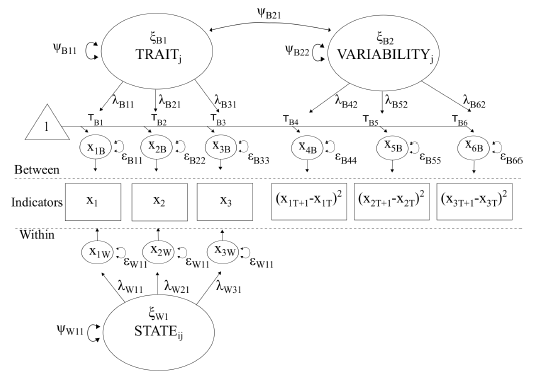
Figure 2. MSEM of state- trait and variability constructs
Note: Indicators are raw data of time-points (t) nested in students (i). Circles above (at the between level, e.g., X1B) and below (at the within level e.g., X1W) the indicators depict latent constructs of decomposed between- and within-level indicators respectively. There is one within-level latent construct (ξW1) and two between-level constructs (ξB1 and ξB2), with factor loadings (λ, one-headed arrows) linking constructs to level-specific indicators. Variances of latent constructs are indicated in double headed arrows (ψ). Residuals of indicators are also depicted with double headed arrows (ε), at the within-level measurement error. The mean-structure (triangle with 1 inside) is estimated at the between-level (i.e., cluster-intercepts, τ).
In the dataset we created lagged variables (xkT+1) of each indicator (xkT) for each student. This gave 285 additional lines of data, one for each participant in our data-matrix, giving a total of nti = 3,718 lines of data (see Appendix 1). We then, in Mplus, defined intraindividual squared deviations (xkT+1 - xkT)2 which we used as indicators (see Appendix 2). The scalar of the MSSD equation, 1/(n-1), was not necessary to apply as there are n-1 number of successive differences for each participant. Calculating the average of the successive differences is to divide the sum of the squared successive differences by n-1. We specified MSEMs, presented in Figures 3-5, for each construct using one (difficulty), two (competence), and three indicators (intrinsic motivation) for each latent construct separately (Models 1-3). We then illustrated how to specify three multivariate models, presented in Figure 6 for investigating convergence between trait and variability constructs, and between variability and task-focus (Models 4-6). We inspected indices of convergence (association of higher magnitude where expected) and divergence (lack of association where expected; Campbell & Fiske, 1959).
Model fit was assessed by inspecting cut-offs for goodness of fit indices: ≤.06 for good model fit using the Root Mean Square Error of Approximation (RMSEA) and the Standardized Root Mean Square Residual for the within (SRMRW) and the between level (SRMRB), and ≥.90 for acceptable and ≥.95 for good model fit for the Comparative Fit Index (CFI; Browne & Cudeck, 1993). Assuming MAR we treated missing data (4.8% of the missing data-points, in the dataset with the non-lagged variables) using the default FIML algorithm in MPlus (Muthén & Muthén, 2012). We used the robust maximum likelihood estimator (MLR) which corrects standard errors for non-normality.
In order to test structural validity of the state, trait, and variability-constructs of each learning experience, we present a univariate MSEM specified with one manifest indicator (task-difficulty), two indicators (competence evaluation), and three indicators (intrinsic motivation). To investigate the association between trait and variability-constructs we report on the correlation between these latent constructs.
As shown in Fig 3, we illustrate how to specify our proposed model using a single item indicator. To identify this model we fixed a number of parameters: all factor loadings (at 1), and residuals (at 0). The pooled within-level variance was ψW1= 0.88 and between ψB1 = 0.26, showing that 22.5% of the variance of task difficulty resided at the between level. We note that the variance of the variability construct, ψB2 = 2.05, was larger than the variance of the trait construct. The association between trait-task-difficulty and variability in task-difficulty was ρ = 0.46, that is the more difficult tasks appeared on average during the week, the more variability in task-difficulty (i.e., larger ups and downs in task difficulty during the week).

Figure 3. Multilevel structural equation model of latent
state, trait and intraindividual variability of task
difficulty.
Note: manifest indicators are diff = task-difficulty
As shown in Fig 4, we illustrate how to specify our proposed model using two indicators. The pooled within-level variance was ψW1 = 0.32 and between ψB1 = 0.13, showing that 29.5% of the variance of competence beliefs resided at the between level. We note that the variance of the variability construct, ψB2 = 0.66, was larger than the variance of the trait construct. The association between trait intrinsic motivation and variability in intrinsic motivation was ρ = -0.72, that is the more competent students thought they were on average during the week, the less variable they thought their competences were during the week (i.e., smaller ups and downs in competence belief during the week).
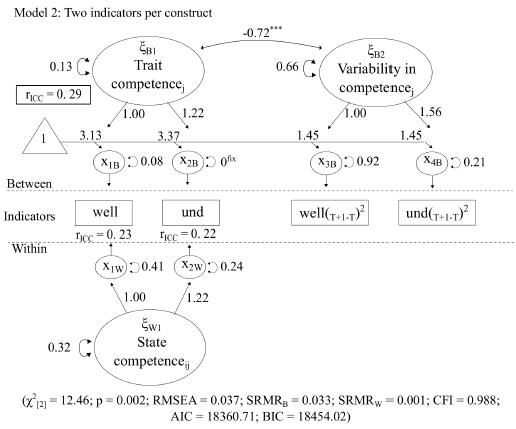
Figure 4. Multilevel structural equation model of latent
state, trait and intraindividual variability of competence
belief.
Note: manifest indicators are well = how well?, und =
understanding
As shown in Fig 5, we illustrate how to specify our proposed model using three indicators. The pooled within-level variance was ψW1= 0.51 and between ψB1 = 0.32, showing that 38.7% of the variance of competence evaluation resided at the between level. We note that the variance of the variability construct, ψB2 = 1.26, was larger than the variance of the trait construct. The association between trait-task-difficulty and variability in task-difficulty was ρ = -0.35, that is the more intrinsically motivated students thought they were on average during the week, the less their motivation fluctuated during the week (i.e., smaller ups and downs in intrinsic motivation during the week).
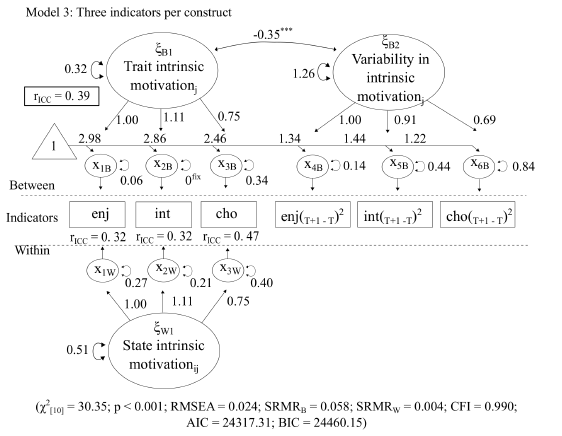
Figure 5. Multilevel structural equation model of latent
state, trait and intraindividual variability of intrinsic
motivation.
Note: manifest indicators are enj = enjoyment, int = interest,
and cho = choice.
In models 4 to 6 we present three possible models for investigating convergent validity of the variability constructs (see Fig 6). In Model 4 we specified three state constructs at the within-level, with three corresponding trait constructs at the between-level, and three variability constructs. The structural parameters of interest are the associations between the trait-construct and variability-construct of task difficulty (ρ = 0.46), competence belief (ρ = -0.64) and intrinsic motivation (ρ = -0.35) respectively. These associations were similar to the ones found in the separate univariate models.
In Model 5 we specified associations between the three trait-constructs and teacher-reported student task-focus, and between variability constructs and task-focus. More task-focused students, on average during the week, found tasks easier (ρ = -0.19), felt more successful (ρ = 0.38), and were more intrinsically motivated (ρ = 0.25). More task-focused students found tasks of more equal difficulty (ρ = -0.26), fluctuated less in their competence beliefs (ρ = -0.35), but were not significantly less variable in their intrinsic motivation.
In Model 6 we specified a higher-order construct of variability. This means that the factor loadings of the higher-order construct explain the associations between the latent constructs. Students who were more variable overall (i.e., a higher value on the higher-order variability construct) found, on average during the week, task more difficult (ρ = 0.50), their competence lower (ρ = -0.62) and were less intrinsically motivated (ρ = -0.32).
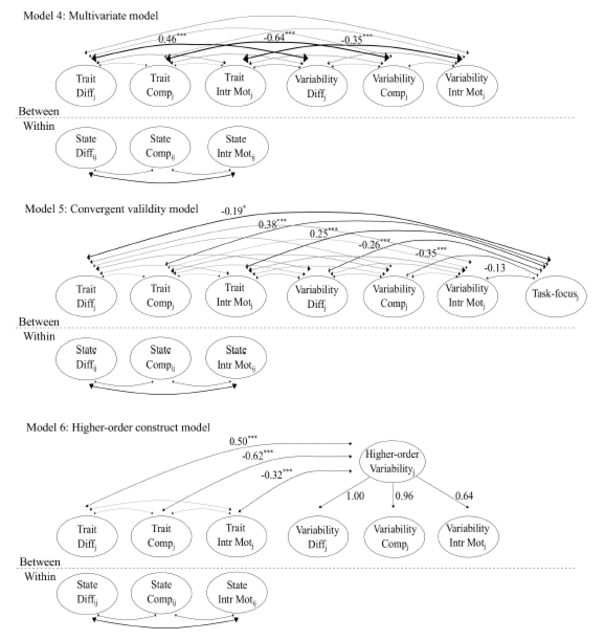
Figure 6. Multivariate models of state, trait and
variability constructs.
Note: Only structural parts of the models shown for clarity.
Estimates (standardized correlations) are from Mplus 7.4 (Muthén
& Muthén, 2012).
In order to advance our understanding of students’ learning processes in real time, we investigated intraindividual variability in students’ learning experiences, and convergence between intraindividual variability and teacher-reported task-focus. Inclusion of such intraindividual variability construct(s) in process models of learning experiences would expand current modelling practices in the field. Up to now, models include: (1) decomposition of learning experiences into within (time-points) and between (students) components, (2) random (moderator) effects of perceptions of the context on learning experiences, and (3) fixed and moderation effects of personal characteristics on learning experiences. As the MSSD captures both magnitude and order of events (von Neumann et al., 1941; Jahng et al., 2008), we created a dataset with lagged variables and specified aggregated variables to use in MSEMs. We specified three latent constructs: a state-construct at the within-level, and a trait and an intraindividual variability construct at the between-level. In response to our first research question regarding the structural validity of state-trait and variability dimensions of learning experiences, we found support for the specificity of the intraindividual variability dimension. Importantly, this suggests that intraindividual variability in learning experiences such as motivation, adaptive behaviours, and competence evaluations capture an important dimension of students’ experiences of learning, in addition to variability of constructs in other fields of research, e.g., affect instability (Trull et al., 2008).
In response to our second research question, we confirmed the hypothesis that trait and variability dimensions of learning experiences converged with teacher-reported task focus. Importantly, teacher reports of higher task-focus were related to more adaptive learning experiences on average during the week (i.e., less difficulty, feeling more competent, experiencing higher intrinsic motivation), and to less variability in these same learning experiences (i.e., a smaller magnitude in momentary fluctuations from one learning episode to the next).
We found three sources of support for the distinction between state, trait and variability dimensions of the same construct. First, MSEM of each learning experience construct in turn (Models 1-3) suggested that state, trait and intraindividual variability are separable constructs. Importantly, this expands existing two-level models in which states and traits have been modeled at the within and between levels respectively (e.g., Roesch et al., 2010). Second, inspection of associations between trait and intraindividual variability constructs at the between level suggested convergence, that is traits and variability dimensions of each construct were moderately to strongly associated |ρ| = .35 to .64. Third, Model 6 suggested that intraindividual variability could be specified as a higher-order construct. Taken together, our MSEM using aggregates of MSSDs of each indicator was deemed successful for portraying the variability dimension. Going beyond previous studies (Malmberg et al., 2013; Schmitz & Skinner, 1993) which have shown that there is more variance within (i.e., intraindividual) than between students (i.e., interindividual difference), we suggest it is possible to retrieve systematic variance of intraindividual experiences by specifying intraindividual variability dimensions of constructs. Importantly, this demonstrates that there are systematic individual differences in how students vary within themselves. There are at least two research contexts in which it could be useful to implement the specification of such an intraindividual variability construct in its own right. First, it could be possible to design intervention studies with bursts of collections of intensive longitudinal data (Schmitz, 2015; Walls, Barta, Stawski, Collyer, & Hofer, 2011). If measures of intraindividual variability could be obtained at both pre- and post-tests, it would be possible to investigate treatment effects geared towards decreasing such intraindividual variability. Second, if reports of student-teacher interaction were possible to collect alongside collection of students’ self-reported learning experiences, it would be possible to specify models in which teacher sensitivity to disengagement or off-task behaviour might alleviate intraindividual variability.
With regard to questionnaire design, we suggest it could be possible to create at least two types of psychometric measures, for researchers who do not aspire to measure processes by collecting intensive longitudinal data. First, while previous self-report measures of emotional self-concept (i.e., emotional stability, meaning the perception of feeling calm, emotionally stable and worried; e.g., Marsh, 1989) and stability of self-esteem (Rosenberg, 1965), have indeed focused on intraindividual variability as a trait, the findings from our present study suggest that it could be possible to create a wider range of “variability-as-a-trait” constructs. Second, while present observation instruments of students’ engagement and task-focus are designed to capture trait aspects (Zhang et al., 2011), future instruments could focus on variability of such observations.
Task-focus, as a psychometric construct, is operationalized as a trait-level of students’ adaptive work habits in classrooms, the extent to which each individual student attempts difficult tasks, persists and stays focused on these (Nurmi, & Aunola, 1998; Aunola et al., 2000; Zhang et al., 2011). Model 5 showed that teacher-reported student task-focus was associated with less difficulty, stronger sense of competence and more intrinsic motivation, in line with Hypothesis 1. In a previous study, lower achievers were found to withdraw effort when confronted with a difficult task, while higher achievers exerted more effort (Malmberg, Walls, et al., 2013). Consistent with the idea that students who experience learning as inherently interesting, pay attention and focus on their task at hand in that learning situation (Nurmi et al., 2008), teacher rated task-focus was also related with higher levels of intrinsic motivation. This does not mean that teachers can "see" students' motivation as such (Lee & Reeve, 2012), but rather intrinsic motivation manifested as energized behaviour (Sheldon & Elliot, 1998). A higher level of task-focus was also related to students’ trait competence evaluation. Competence belief also varied from one learning situation to another. Future studies should investigate to what extent this is linked with experiences of particular school subjects or particular teachers. Taken together, the current and the previous study hint at the importance to further investigate stability and variability in the ways teachers support and place demands on students, that are optimal for students’ learning over time.
There were three important associations between task-focus and variability. A higher level of task-focus was related, first, to less variability in difficultly and competence beliefs, and, second, to a higher level of the higher-order variability-construct. Importantly, it appears that variability could be construed as a trait dimension in itself. The variability-construct might play an important role in models of self-regulation (Boekaerts & Corno, 2005), in which “top-down” self-regulation is typical of students who steer their learning processes by setting goals for enhancing their knowledge by sustaining motivation, rather than being obstructed by situational demands and setbacks typical of “bottom-up” self-regulation. An important future research task would be to investigate intraindividual variability in relation to self-set learning goals (or the lack of such goals).
There are two important implications of students’ variability in learning experiences for the different ways in which teachers can support different students. First, the variability in itself demonstrates that all students have ups and downs, less task-focused students more so than more task-focused students. It would be important for teachers to capture the “ups”, particularly of less task-focused students. Teachers want to capitalize on students’ “ups” as these would be teachable moments (Hamre & Pianta, 2005; Pianta & Hamre, 2009). Second, the variability in students’ learning experiences is inherently linked to experiences of the learning context. From the teachers’ point of view there lurks a danger in them classifying students as “engaged” or “disengaged” as all students have their ups and downs. This means that “engaged” students have their disengaged moments. These are moments when teachers can redirect students. It also means that “disengaged” students have their engaged moments. These moments are the ones to capitalize on for learning; the others for redirection. It would be important also for teacher educators to focus on the meaning of intraindividual variability, allowing prospective teachers to focus on changes in student behaviours and actions in real time.
In future studies, it would be important to combine studies of students’ intraindividual variability and measure of teacher support. Teachers in classrooms can promote students’ learning processes by supporting their autonomy (Reeve, Jang, Carrell, Jeon, & Barch, 2004), being involved with students and structuring the learning contents (Skinner & Belmont, 1993), providing task-contingent praise (Deci, Koestner, & Ryan, 1999), providing feedback directed at reducing discrepancies between current understanding and learning goals (Hattie & Timperley, 2007), and tailoring goals to individual learners (Hattie, Biggs, & Purdie, 1996; Butler & Winne, 1995; Pianta, Belsky, Vandergrift, Hours, & Morrison, 2008), in order to enhance motivation, effort, and selection of optimally difficult tasks.
There were three limitations of the present study. First, the lagged variables we created spanned from 5 to 29 observations, which is shorter than the typical time-series model. However, for the purpose of calculating the MSSD the number of observations might be sufficient (Ebner-Priemer et al., 2009). Future studies of students’ learning processes should aim at collecting more repeated measures for the purpose of creating longer time-series. Such a demand needs to be carefully weighed against the risks of response fatigue of participants. Second, the model we applied assumes equivalent duration between each time-lag (e.g., Jahng et al., 2008). Thus our models do not account for unequal number of responses per day, unequal lags between each subsequent reports, and downtime when not at school. The current findings would need to be replicated with models more suitable for unequally spaced lagged data. Third, the empirical data stem from a particular age-group in a particular sociocultural context, England, so replications in other contexts and age-groups would be valuable to carry out.
Variability in intraindividual learning experiences captures the abruptness, frequency, order, and magnitude of students’ “ups and downs” in their engagement during a week at school. Teacher perceived student task-focus converged with both trait-levels and variability in task difficulty, competence beliefs and intrinsic motivation. Intraindividual variability formed a higher-order construct. Overall, our study provides support for intraindividual variability as a construct in its own right, which has the potential to provide novel insight into students’ learning processes.
The Learning Every Lesson (LEL) study was funded by the John Fell Foundation, and carried out during the first author’s Research Councils UK (RCUK) fellowship 2007-12.
Aunola, K., Nurmi, J.-E., Parrila, R., & Onatsu-Arvilommi,
T. (2000). Behavioral strategy relating scale II.
Unpublished measurement instrument Jyväskylä: University of
Jyväskylä, Finland.
Boekaerts, M., & Corno, L. (2005). Self-regulation in the
classroom: A perspective on assessment and intervention. Applied
Psychology: An International Review, 54, 199-231. doi:
10.1111/j.1464-0597.2005.00205.x
Browne, M. W., & Cudeck, R. (1993). Alternative ways of
assessing model fit. In K. A. Bollen, & J. S. Long (Eds.), Testing
structural equation models (pp. 136-162). Beverly Hills,
CA: Sage.
Butler, D. L., & Winne, P. H. (1995). Feedback and
self-regulated learning: A theoretical synthesis. Review of
Educational Research, 65, 245-281.
doi:10.3102/00346543065003245
Campbell, D. T., & Fiske, D. W. (1959). Convergent and
discriminant validation by the multitrait-multimethod matrix. Psychological
bulletin, 56, 81-105. doi:10.1037/h0046016
Deci, E. L., Koestner, R., & Ryan, R. M. (1999). A
meta-analytic review of experiments examining the effects of
extrinsic rewards on intrinsic motivation. Psychological
Bulletin, 125, 627–668. doi:10.1037/0033-2909.125.6.627
Ebner-Priemer, U. W., Eid, M., Kleindienst, N., Stabenow, S.,
& Trull, T. J. (2009). Analytic strategies for understanding
affective (in)stability and other dynamic processes in
psychopathology. Journal of Abnormal Psychology, 118,
195–202. doi:10.1037/a0014868
Eccles, J. S., Midgley, C., Wigfield, A., Buchanan, C. M.,
Reuman, D., Flanagan, C., & MacIver, D. (1993). Development
during adolescence: The impact of stage-environment fit on young
adolescents’ experiences in schools and in families. American
Psychologist, 48, 90-101. doi:10.1037/0003-066X.48.2.90
Eccles, J. S., Wigfield, A., & Schiefele, U. (1998).
Motivation to succeed. In W. Damon & N. Eisenberg, (Eds.),
Handbook of child psychology, 5th ed.: Vol 3. Social,
emotional, and personality development (pp. 1017-1095).
Hoboken, NJ.: John Wiley & Sons.
Eid, M., & Diener, E. (1999). Intraindividual variability in
affect: Reliability, validity, and personality correlates. Journal
of Personality and Social Psychology, 76, 662-676.
doi:10.1037/0022-3514.76.4.662
Eid, M., & Langeheine, R. (2003). Separating stable from
variable individuals in longitudinal studies by mixture
distribution models. Measurement: Interdisciplinary
Research and Perspectives, 1, 179-206.
doi:10.1207/S15366359MEA0103_01
Eizenman, D. R., Nesselroade, J. R., Featherman, D. L., &
Rowe, J.W. (1997). Intraindividual variability in perceived
control in an older sample: The MacArthur Successful Aging
studies. Psychology and Aging, 12, 489-502.
doi:10.1037/0882-7974.12.3.489
Georgiou, G., Manolitsis, G., Nurmi, J.-E., & Parrila, R.
(2010). Does task-focused versus task-avoidance behavior matter
for literacy development in an orthographically consistent
language? Contemporary Educational Psychology, 35,
1−10. doi:10.1016/j.cedpsych.2009.07.001
Gill, P., & R. Remedios, R. (2013). How should researchers
in education operationalise on-task behaviours? Cambridge
Journal of Education, 43, 199-222.
doi:10.1080/0305764X.2013.767878
Goetz, T., Frenzel, A. C., Stoeger, H., & Hall, N. C.
(2010). Antecedents of everyday positive emotions: An experience
sampling analysis. Motivation and Emotion, 34,
49-62. doi:10.1007/s11031-009-9152-2
Hamre, B. K., & Pianta, R. C. (2005). Can instructional and
emotional support in the first-grade classroom make a difference
for children at risk of school failure? Child Development,
76, 949-967. doi:10.1111/j.1467-8624.2005.00889.x
Hattie, J., Biggs, J., & Purdie, N. (1996). Effects of
learning skills interventions on student learning: a
meta-analysis. Review of Educational Research, 66, 99-136.
doi:10.3102/00346543066002099
Hattie, J., & Timperley, H. (2007). The power of feedback. Review
of Educational Research, 77, 81-112.
doi:10.3102/003465430298487
Hirvonen, R., Tolvanen, A., Aunola, K., & Nurmi, J.-E.
(2012). The developmental dynamics of task-avoidant behavior and
math performance in kindergarten and elementary school.
Learning and Individual Differences,22, 715-723. doi:
10.1016/j.lindif.2012.05.014
Hooker, K., Nesselroade, D. W., Nesselroade, J. R., &
Lerner, R. M. (1987). The structure of intraindividual
temperament in the context of mother-child dyads: P-technique
factor analyses of short-term change. Developmental
Psychology, 23, 332-346. doi:10.1037/0012-1649.23.3.332
Ilies, R., & Judge, T. A. (2002). Understanding the dynamic
relationships among personality, mood, and job satisfaction: A
field experience sampling study. Organizational Behavior
and Human Decision Processes, 89, 1119–1139.
doi:10.1016/S0749-5978(02)00018-3
Inkinen, M., Lonka, K., Hakkarainen, K., Muukkonen, H.,
Litmanen, T., & Salmela-Aro, K. (2013). The interface
between core affects and the challenge-skill relationship. Journal
of Happiness Studies, 15, 891-913.
doi:10.1007/s10902-013-9455-6
Jahng, S., Wood, P. K., & Trull, T. J. (2008). Analysis of
affective instability in ecological momentary assessment:
indices using successive difference and group comparison via
multilevel modeling. Psychological Methods, 13, 354–375.
doi:10.1037/a0014173
Kernis, M. H., Grannemann, B. D., & Barclay, L. C. (1989).
Stability and level of self-esteem as predictors of anger
arousal and hostility. Journal of Personality and Social
Psychology, 56, 1013-1022.
doi:10.1037/0022-3514.56.6.1013
La Guardia, J. G., Ryan, R. M., Couchman, C. E., & Deci, E.
L. (2000). Within-person variation in security of attachment: A
self-determination theory perspective on attachment, need
fulfillment, and well-being. Journal of Personality and
Social Psychology, 79, 367-384.
doi:10.1037/0022-3514.79.3.367
Larsen, R. J. (1987). The stability of mood variability: a
spectral analytic approach to daily mood assessments. Journal
of Personality and Social Psychology, 52, 1195-1204.
doi:10.1037/0022-3514.52.6.1195
Lee, W., & Reeve, J. (2012). Teachers’ estimates of their
students’ motivation and engagement: Being in synch with
students. Educational Psychology, 32, 727–747.
doi:10.1080/01443410.2012.732385
Li, X., & Hedeker, D. (2012). A three-level mixed-effects
location scale model with an application to ecological momentary
assessment data. Statistics in Medicine, 31, 3192-3210.
doi:10.1002/sim.5393
Malmberg, L.-E., Walls, T., Martin, A. J., Little, T. D., &
Lim, W. H. T. (2013). Primary school students' learning
experiences of, and self-beliefs about competence, effort, and
difficulty: Random effects models. Learning and Individual
Differences, 28, 54–65. doi:10.1016/j.lindif.2013.09.007
Malmberg, L.-E., Woolgar, C., & Martin, A. (2013). Quality
of measurement of the Learning Experience Questionnaire for
Personal Digital Assistants. International Journal of
Quantitative Research in Education, 1, 275-296.
doi:10.1504/IJQRE.2013.057689
Malmberg, L.-E., Pakarinen, E., Vasalampi, K., & Nurmi, J-E.
(2015). Students’ school performance, task-focus, and
situation-specific motivation. Learning and Instruction,
39, 158-167. doi:10.1016/j.learninstruc.2015.05.005
Marsh, H. W. (1989). Age and sex effects in multiple dimensions
of self-concept: preadolescence to early adulthood. Journal
of Educational Psychology, 81, 417-430.
doi:10.1037/0022-0663.81.3.417
McConville, C., & Cooper, C. (1997). The temporal stability
of mood variability. Personality and Individual
Differences, 23, 161-164.
doi:10.1016/S0191-8869(97)00013-5
Morin, A. J. S., Marsh, H. W., Nagengast, B., & Scalas, L.
F. (2014). Doubly latent multilevel analyses of classroom
climate: An illustration. The Journal of Experimental
Education, 82, 143-167. doi:10.1080/00220973.2013.769412
Musher-Eizenman, D. R., Nesselroade, J. R., & Schmitz, B.
(2002). Perceived control and academic performance: A comparison
of high- and low-performing children on within-person change
patterns. International Journal of Behavioral Development,
26, 540–547. doi:10.1080/01650250143000517
Muthén, L. K. & Muthén, B. O. (2012). Mplus statistical
analysis with latent variables: User’s guide (Version 7).
Los Angeles, CA: Muthén & Muthén.
Nett, U. E., Goetz, T., & Hall, N. C. (2011). Coping with
boredom in school: An experience sampling perspective. Contemporary
Educational Psychology, 36,49–59.
doi:10.1016/j.cedpsych.2010.10.003
Nett, U. E., Goetz, T., Hall, N. C., & Frenzel, A. C.
(2012). Metacognitive strategies and test performance: An
experience sampling analysis of students’ learning behavior. Education
Research International. Article ID 958319, 16 pages.
[online]
http://kops.ub.uni-konstanz.de/handle/urn:nbn:de:bsz:352-206102
(Accessed 12 April 2013).
Nurmi, J.-E., & Aunola, K. (1998). Observer Rating
Scale of Achievement Strategies (OSAS). Unpublished
measurement instrument. Jyväskylä: University of Jyväskylä,
Finland.
Nurmi, J.-E., Hirvonen, R., & Aunola, K. (2008). Motivation
and achievement beliefs in elementary school: A holistic
approach using longitudinal data. Unterrichtswissenschaft,
36(3), 237–254. doi:10.3262/UW0803237
Pianta, R. C., & Hamre, B. K. (2009). Conceptualization,
measurement, and improvement of classroom processes:
Standardized observation can leverage capacity. Educational
Researcher, 38, 109-119. doi:10.3102/0013189X09332374
Pianta, R. C., Belsky, J., Vandergrift, N., Hours, R., &
Morrison, F. (2008). Classroom effects on children’s achievement
trajectories in elementary school. American Educational
Research Journal, 45, 365-397.
doi:10.3102/0002831207308230
Ram, N., Chow, S.-M., Bowles, R. P., Wang, L., Grimm, K.,
Fujita, F., & Nesselroade, J. R. (2005). Examining
interindividual differences in cyclicity of pleasant and
unpleasant affect using spectral analysis and item response
modeling. Psychometrika, 70, 773-790.
doi:10.1007/s11336-001-1270-5
Reeve, J., Jang, H., Carrell, D., Jeon, S., & Barch, J.
(2004). Enhancing students’ engagement by increasing teachers’
autonomy support. Motivation and Emotion, 28, 147-169.
doi:10.1023/B:MOEM.0000032312.95499.6f
Roesch, S. C., Aldridge, A. A., Stocking, S. N., Villodas, F.,
Leung, Q., Bartley, C. E. & Black, L. J. (2010). Multilevel
factor analysis and structural equation modeling of daily diary
coping data: Modeling trait and state variation. Multivariate
Behavioral Research, 45, 767-789.
doi:10.1080/00273171.2010.519276
Rosenberg, M. (1965). Society and the adolescent
self-image. Princeton, N J: Princeton University Press.
Schmitz, B. (2006). Advantages of studying processes in
educational research. Learning
and Instruction, 16, 433-449.
doi:10.1016/j.learninstruc.2006.09.004
Schmitz, B. (2015). The study of learning processes using
time-series analyses [Video file]. Available from
http://www.education.ox.ac.uk/network-on-intrapersonal-research-in-education-nire/seminar-1/bernhard-schmitz/
Schmitz, B., & Skinner, E. (1993). Perceived control,
effort, and academic performance: Interindividual,
intraindividual, and multivariate time-series analyses.
Journal of Personality and Social Psychology, 64,
1010-1028. doi:10.1037/0022-3514.64.6.1010
Schmitz, B. & Wiese, B. S. (2006). New perspectives for the
evaluation of training sessions in self-regulated learning:
Time-series analyses of diary data. Contemporary
Educational Psychology, 31, 64 – 96.
doi:10.1016/j.cedpsych.2005.02.002
Sheldon, K. M. & Elliot, A. J. (1998). Not all personal
goals are personal: Comparing autonomous and controlled reasons
for goals as predictors of effort and attainment. Personality
and Social Psychology Bulletin, 24, 546-557.
doi:10.1177/0146167298245010
Skinner, E. A., & Belmont, M. J. (1993). Motivation in the
classroom: Reciprocal effects of teacher behavior and student
engagement across the school year. Journal of Educational
Psychology, 85, 571-581. doi:10.1037/0022-0663.85.4.571
Trull, T. J., Solhan, M. B., Tragesser, S. L., Jahng, S., Wood,
P. K., Piasecki, T. M., & Watson, D. (2008). Affective
instability: Measuring a core feature of borderline personality
disorder with ecological momentary assessment. Journal of
Abnormal Psychology, 117, 647-661. doi:10.1037/a0012532
Tsai, Y-M., Kunter, M., Lüdtke, O. & Trautwein, U. (2008).
Day-to-day variation in competence beliefs: How autonomy support
predicts young adolescents’ felt competence In H. W., Marsh, R.
G., Craven, & D. M., McInerney (Eds.), Self-processes,
learning, and enabling human potential: dynamic new approaches
(pp. 119-143). Charlotte, NC:Information Age Publishing..
von Neumann, J., Kent, R. H., Bellinson, H. R., & Hart, B.
I. (1941). The mean square successive difference. The
Annals of Mathematical Statistics, 12, 153–162.
doi:10.1214/aoms/1177731746
Walls, T. A., Barta, W. D., Stawski, R. S., Collyer, C, &
Hofer, S. M. (2011). Time-scale dependent longitudinal designs.
In B. Laursen, T. D. Little, & N. Card (Eds.), Handbook
of developmental research methods (pp. 46-64).
New York: Guilford Press.
Wilhelm, P., Perrez, M., & Pawlik, K. (2012). Conducting
research in daily life. In M. R. Mehl, and T. S. Conner, (Eds.),
Handbook of research methods for studying daily life
(pp. 62-68). New York: Guilford Press.
Zhang, X., Nurmi, J-E., Kiuru, N., Lerkkanen, M.-K., &
Aunola, K. (2011). A teacher-report measure of children's
task-avoidant behavior: A validation study of the Behavioral
Strategy Rating Scale. Learning and Individual Differences,
21, 690–698. doi:10.1016/j.lindif.2011.09.007
Zimmerman, B. J. (2000). Self-efficacy: An essential motive to
learn. Contemporary Educational Psychology, 25, 82–91.
doi:10.1006/ceps.1999.1016
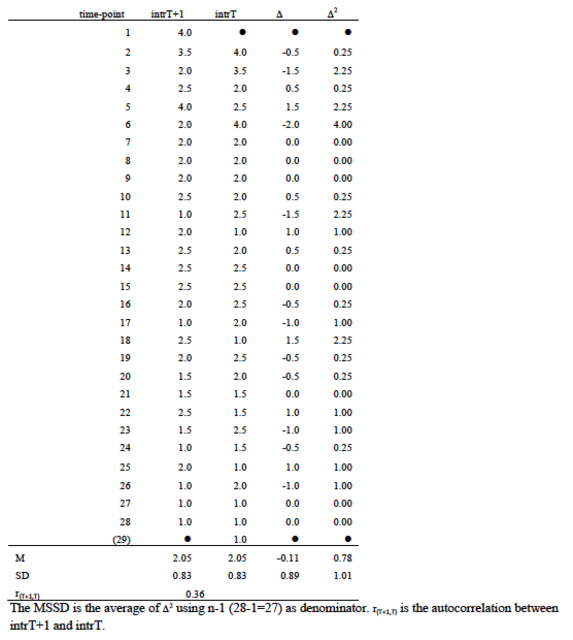
This hand-calculation presents the values of Panel A in Figure 1. The columns below represent: time-point = 28 time-points for one individual. Note that the numeric values of intrT+1 are replicated in the intrT column, only one row below each corresponding intrT+1 value. This gives a 29th time-point; intrT+1 = intrinsic motivation at time-point T+1; intrT = intrinsic motivation at time-point T. This variable was created by lagging the intrT+1 variable one time-point step. Time-point T becomes a predictor of time-point T+1; Δ = difference between intrT+1 and intrT; Δ2 = squared difference between intrT+1 and intrT; = missing data created by the lag.
TITLE: MSSD 28 June 2016 ;
DATA: FILE IS "C:\variability.txt" ;
VARIABLE: NAMES ARE
studid sequence lag_n
diff_t1 diff_t0
well_t1 well_t0 und_t1 und_t0
enj_t1 enj_t0 int_t1 int_t0 cho_t1 cho_t0
focus1 focus2 focus3 avoid1 avoid2 avoid3 ;
!enj=enjoyment, int=interest, cho=choice, t1 = time T+1, t0 =
time T
USEVAR = enj_t1 int_t1 cho_t1 enj_var int_var cho_var ; !include
three observed and three defined variables
MISSING ALL (-9) ;
BETWEEN enj_var int_var cho_var ; !defined variables are at
level 2
CLUSTER = studid; !clustering by student DEFINE:
enj_va = (enj_t1 - enj_t0)**2 ; !squared difference of enjoyment
int_va = (int_t1 - int_t0)**2 ; !average squared difference of
enjoyment
cho_va = (cho_t1 - cho_t0)**2 ;
!squared difference of interest
enj_var = CLUSTER_MEAN (enj_va) ; !average squared difference of
interest
int_var = CLUSTER_MEAN (int_va) ;
!squared difference of choice
cho_var = CLUSTER_MEAN (cho_va) ; !average squared difference of
choice
CENTER (grandmean) enj_t1 int_t1 cho_t1 enj_var int_var cho_var
; !grand mean centre level 2 indicators
ANALYSIS: TYPE = TWOLEVEL ;
MODEL:
%WITHIN%
w_intr BY enj_t1 (a)
int_t1 (b)
cho_t1 (c) ;
! w_ = state-construct (within-level)
! factor loadings of within and between indicators are equated
between level
w_intr (var_w) ;
!estimate variance, and use for calculating new parameter
%BETWEEN%
b_intr BY enj_t1 (a)
int_t1 (b)
cho_t1 (c) ;
! b_intr = trait-construct
intr_var BY enj_var int_var cho_var ;
! variability construct
b_intr WITH intr_var ;
b_intr (var_b) ;
!estimate variance, and use for calculating new parameter
int_t1*.05 (br1) ;
! estimate error variance
MODEL CONSTRAINT:
br1 > 0 ; !br2 > 0 ;
NEW(var_comp);
var_comp = var_b / (var_b + var_w) ;
! calculate intraclass correlation of latent constructs
OUTPUT: STAND SAMPSTAT TECH1 TECH2 ;